EAT, exercise calorie expenditure explained. The only TDEE bucket you can decide to raise, and the one wearables measure most poorly.
How many calories your sport really costs you, why your watch lies, and how Lean models EAT from your tracked session, not from a generic average.
 The Lean Team · 11 min read · Updated May 26, 2026

 Free download
EAT is the calorie expenditure of your sport sessions. It depends on four things: the real effort durationNot the time spent in the gym, the real muscle contraction time., intensity (measured in MET, Metabolic Equivalent of Task), your body mass, and your movement economy (a trained runner burns less than a beginner at the same pace). Wearables overestimate EAT because they count rest time as effort. Lean models EAT from validated MET tables and your personalised BMR on real bodyfat, without wearable bias.
EAT, the E in the daily calorie puzzle
Your body burns calories continuously, even still. The sum of all that expenditure over 24 hours is called the TDEE (Total Daily Energy Expenditure). It breaks down into four clearly distinct bricks, each with its own physiology and its own calculation method. EAT is one of them.
EAT is precisely the share tied to planned exercise : a strength training session, a jog, an hour of tennis, cycling, yoga. What steps out of involuntary daily life and what separates from rest. Everything you make move on top of the day’s strict minimum falls here.
The gap with NEAT is sharp: walking to the subway, climbing stairs, standing at your desk, none of that is EAT, it is NEAT. EAT begins when you consciously decide « I am training » and you book a slot in your calendar for it. This distinction is what makes EAT both easy to motivate mentally, and hard to measure correctly.
What happens when you move
During effort, your muscles burn ATP at an accelerated rate. To rebuild that ATP, your body mobilises three energy pathways: the anaerobic alactic system (very short, explosive), the anaerobic lactic system (intense efforts up to 2 minutes), and the aerobic system (beyond, oxidation of carbs then fats). The exact blend depends on intensity and duration.
This whole process burns oxygen and releases heat. Indirect calorimetry measures that oxygen consumption (VO2) and converts it into kilocalories. It is the scientific reference for quantifying EAT, and it is also the foundation of the MET tables used in real life.
Beyond the session itself, there is a delayed effect called EPOC (Excess Post-exercise Oxygen Consumption). For several hours after an intense effort, your metabolism stays elevated to repair muscle micro-tears, rebuild glycogen stores and restore homeostasis. EPOC adds 5 to 15 % to the session itself, more after HIIT, little after a quiet walk.
Practical consequence: the same hour of sport can cost 200 kcal or 700 kcal depending on the pathway used, the muscle mass engaged, and the intensity. That is why a single generic figure « 1 hour of sport = X kcal » makes no sense.
What works, what does not work to measure EAT
Three big families of methods coexist. One is precise and inaccessible. One is rigorous and usable. One is convenient and misleading.
Indirect calorimetry
Measures O2 consumption and CO2 production via a mask. Near-perfect precision, error margin under 3 %. Restricted to physiology labs, elite athletes and research. No consumer use.
MET tables (Compendium of Physical Activities)
Every activity has a validated MET coefficient (1 MET = rest, 8 MET = jogging 10 km/h, 6 MET = tennis, 3 to 5 MET = moderate strength training). Combined with your BMR on real bodyfat, you get an honest estimate of expenditure per minute. That is the approach Lean uses.
Consumer wearables (Apple Watch, Garmin, Fitbit)
Proprietary algorithms based on heart rate + accelerometer. 2017 Stanford study on 7 major sensors: the best missed by 27 % on average, the worst by 93 % on exercise expenditure. Rest pauses between sets are counted as intense sport.
The wearables problem is not the hardware, it is the formula. Heart rate can rise for non-muscular reasons (stress, coffee, heat, dehydration). And the accelerometer cannot tell a « useful » movement from a parasitic one. Lean deliberately takes the opposite stance: you declare your session and its effective duration, and the app computes from the real MET + your personalised metabolism.
The four levers that move EAT
For the same session displayed as « 1 hour of sport », real expenditure varies by a factor of 1 to 3 between two people. Four parameters explain most of that gap.
Real effort duration
90 minutes at the gym do not mean 90 minutes of lifting. Most of the time is recovery between sets. Count effective time under tension: typically 30 to 45 minutes out of 90 in the weight room, 20 minutes of running out of 60 in a recreational tennis match.
Intensity (MET)
Gentle yoga: 2.5 MET. Leisure cycling: 4 MET. Moderate strength training: 3.5 MET. Jogging 10 km/h: 10 MET. Sprint intervals: 12 to 16 MET. Intensity directly drives kcal per minute, and it is measurable.
Body mass
A 95 kg person burns about 35 % more than a 65 kg person for the same activity (MET formula: kcal/min = MET × weight kg × 0.0175). Ignoring mass means being off by a third from the start.
Movement economy
A trained runner burns 10 to 20 % less energy than a beginner at the same pace, thanks to a more efficient technique. MET tables do not capture that dimension. Your real MET score drops with training.
Practical conclusion: a 90 kg man doing 45 effective minutes of strength training at 4 MET burns about 280 kcal of EAT. The same trained man doing 60 minutes of jogging at 10 km/h, 10 MET, burns 945 kcal. For a 60 kg woman on the same jogging session: 630 kcal. These are orders of magnitude, not promises to the gram.
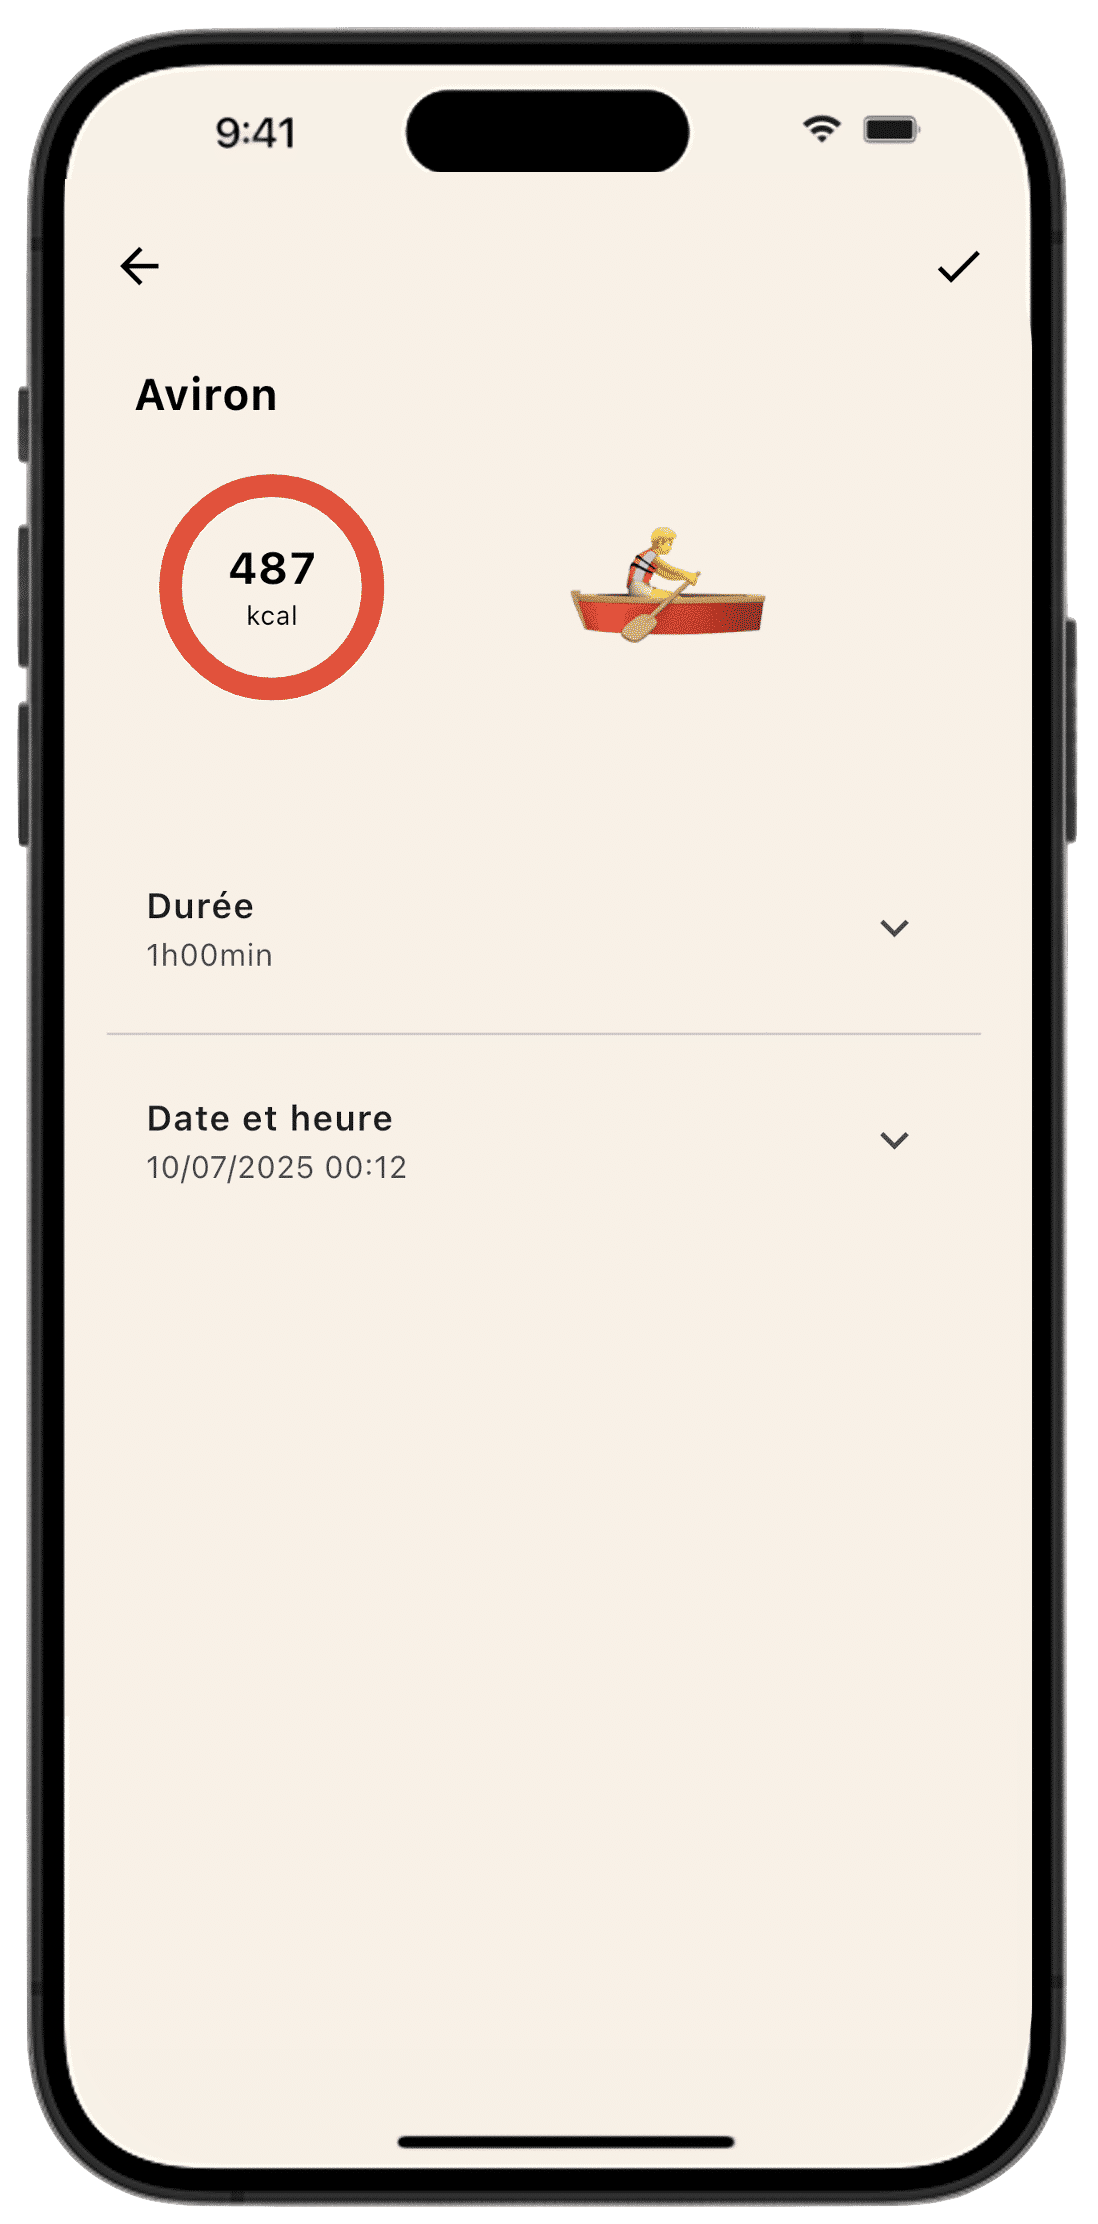
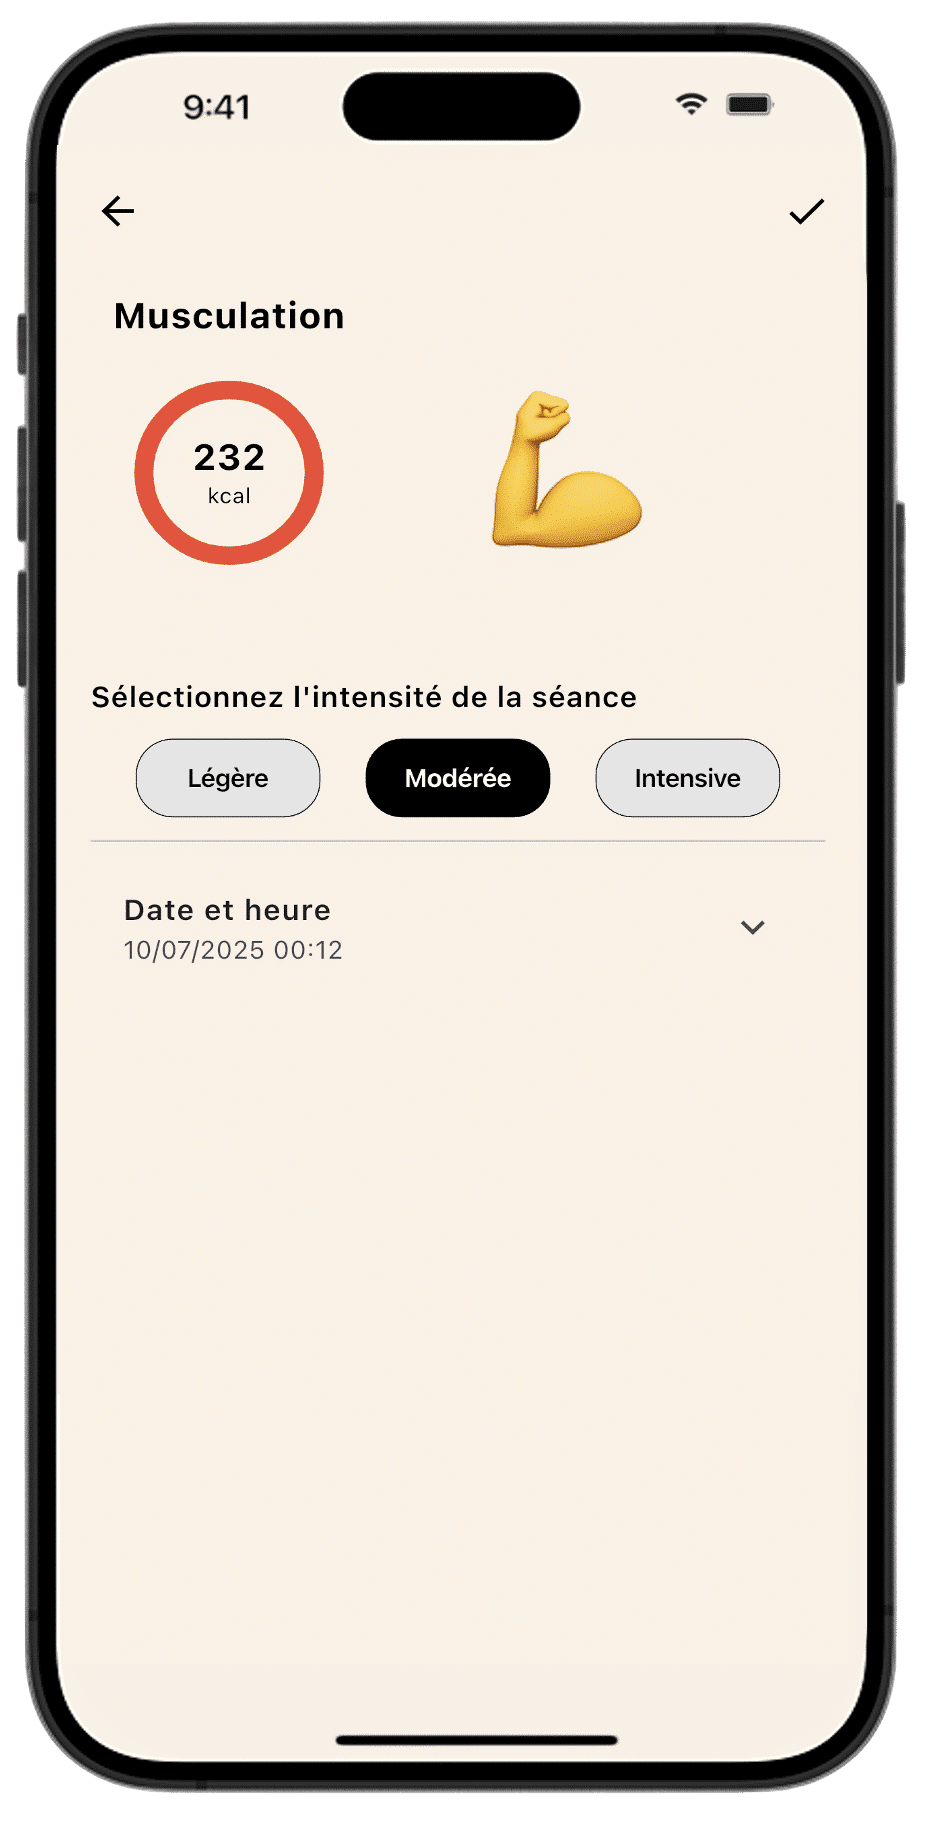
EAT weighs less than you think
This is probably the most counter-intuitive result in the physiology of calorie expenditure: EAT, the bucket everyone thinks of first when talking about « burning calories », is in fact the smallest bucket of TDEE for most people.
Order of magnitude over a full day, for a moderately active 80 kg man:
BMR
About 1,750 kcal/day, i.e. 60 to 70 % of TDEE. It is what your body burns at rest to run brain, liver, heart, kidneys. Modulated by your real bodyfat in Lean.
NEAT
About 400 kcal/day for 10,000 steps, i.e. 15 to 20 % of TDEE. Steps, standing, daily gestures. This is where the big lever ignored by classic apps hides.
EAT
About 250 kcal/day with 4 sessions per week of 45 minutes, i.e. 5 to 10% of TDEE. In elite athletes, this bucket can climb to 20 to 30 %.
TEF
About 250 kcal/day, i.e. around 10 % of TDEE. Energy spent digesting. Proteins cost 25 %, carbs 8 %, fats 3 %.
Strategic consequence: adding 3,000 steps a day (about 120 kcal of extra NEAT) over a week often beats adding one weekly sport session. That is not a reason to drop training (cardiovascular health and muscle mass depend on EAT), but it is a reason not to rely on it alone for fat loss.
Lean compared to Yazio on EAT: the ×10 gap
Most trackers inflate EAT. Yazio illustrates the problem: for a 60 minute strength training session, the app displays nearly 2,000 kcal burned. This is physiologically impossible for a human who is neither a pro cyclist nor an ultra-trailer.
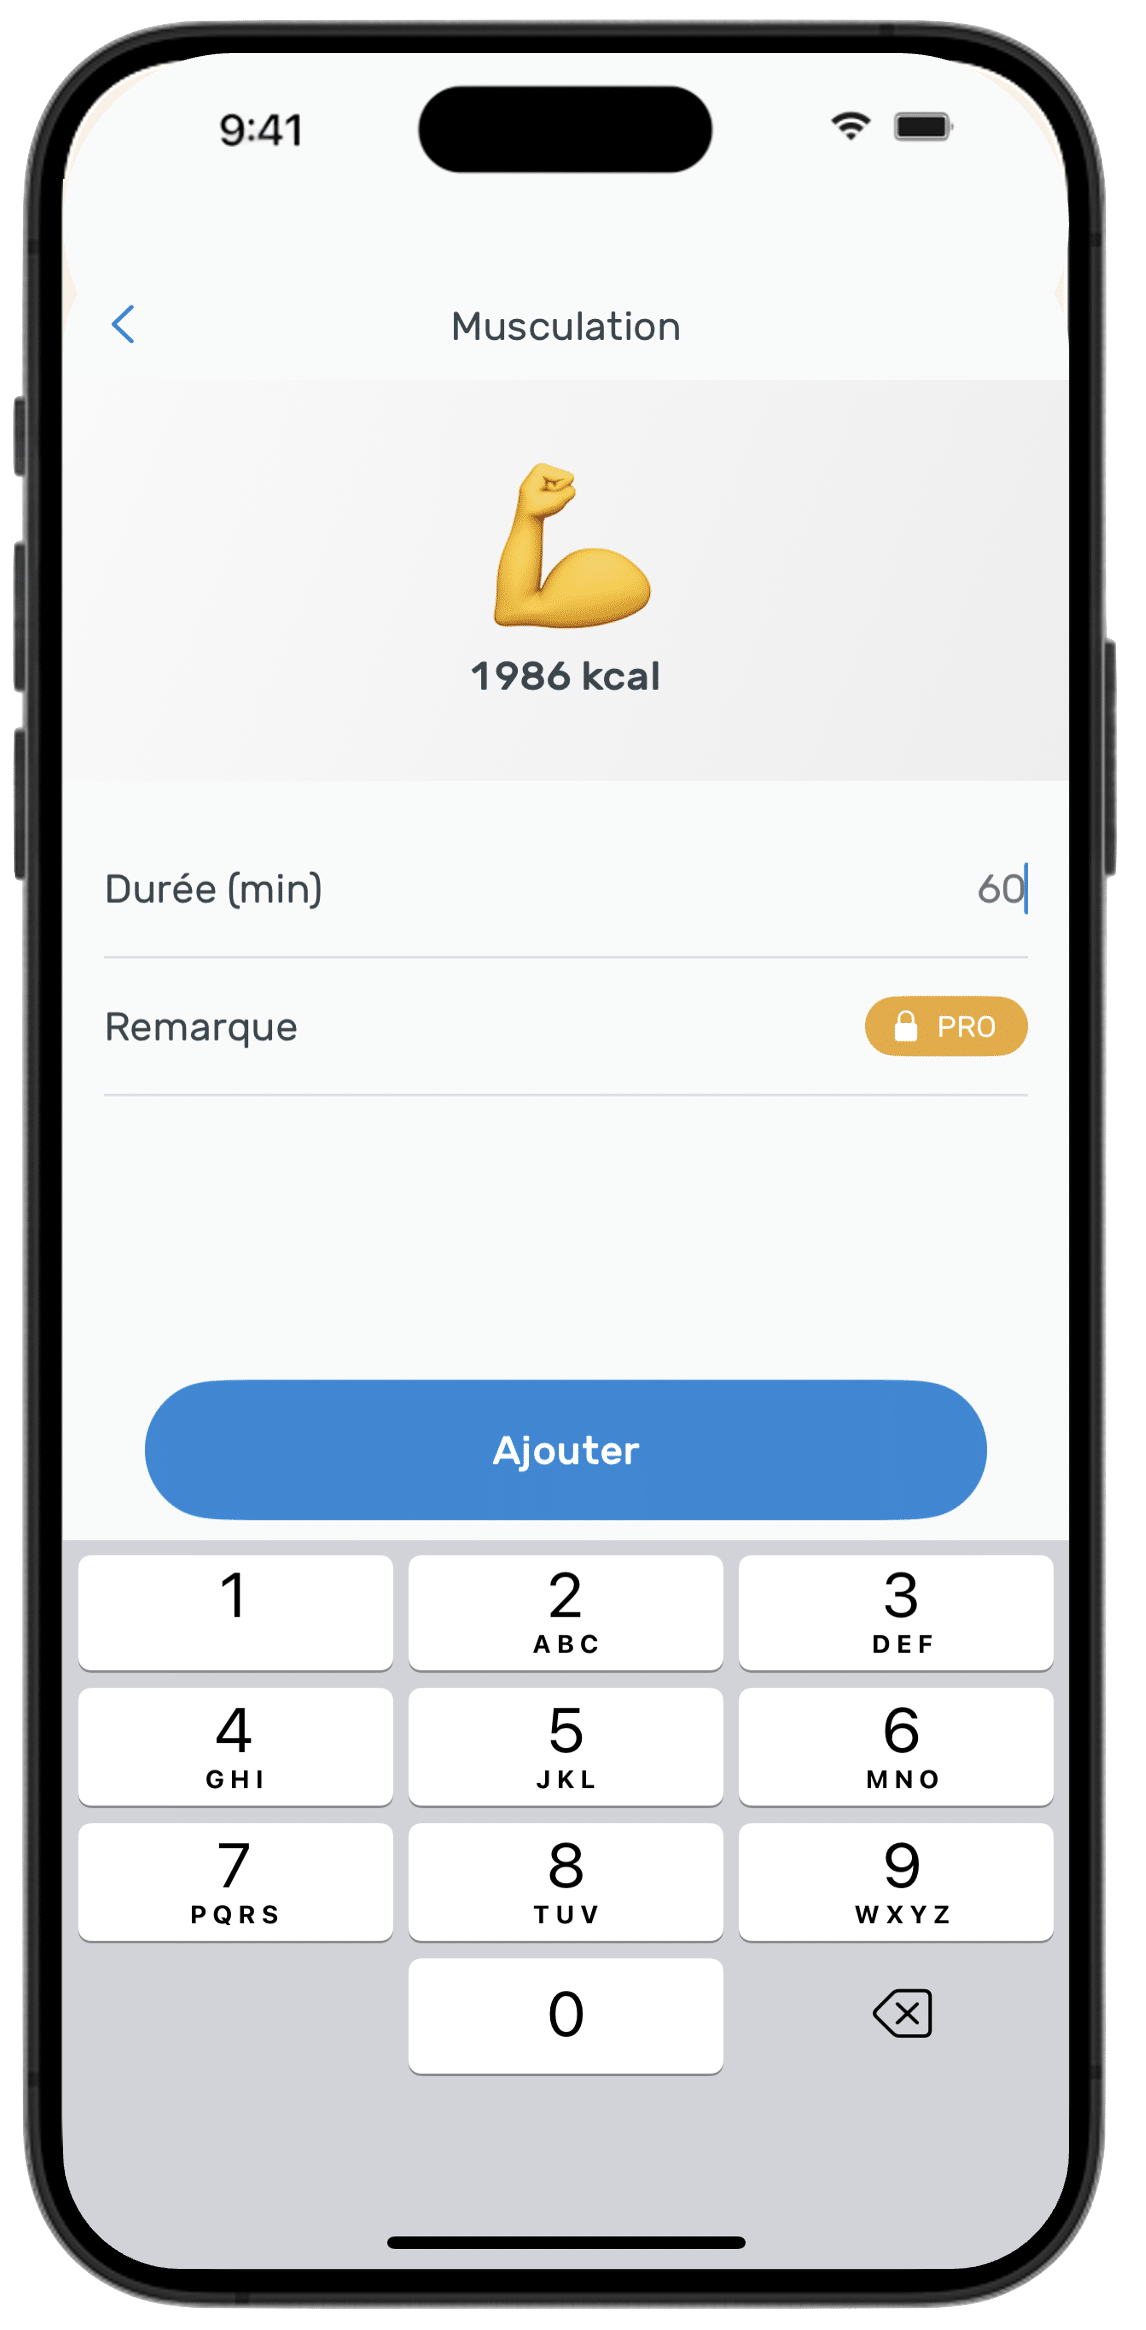
60 min strength training overestimated ×10.
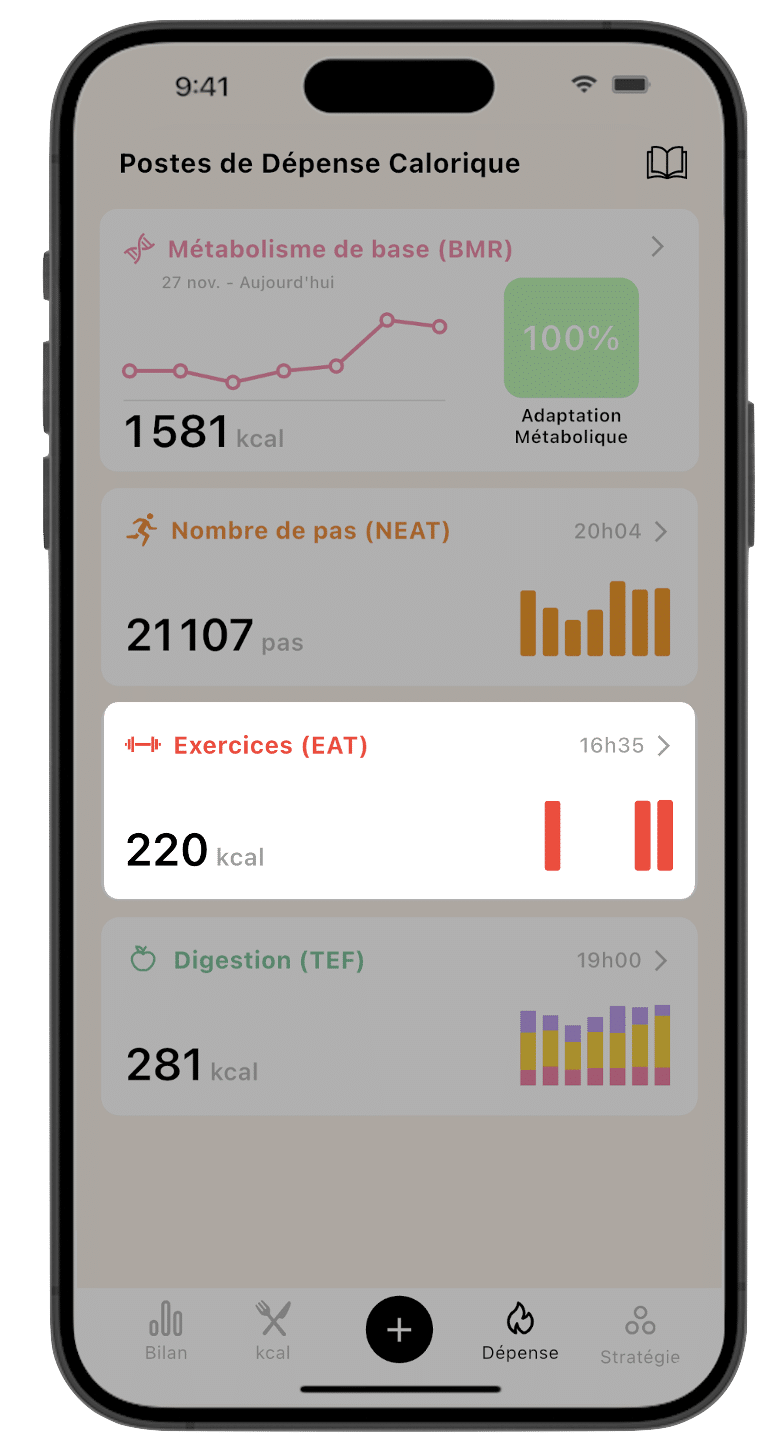
MET Ainsworth 2011, BMR on bodyfat.
Strength training MET source: Ainsworth BE et al., 2011 Compendium of Physical Activities, Med Sci Sports Exerc, 2011; 43(8): 1575 to 1581. General strength training MET = 3.5 to 6.0 depending on intensity. Calculation: kcal/min = MET x 3.5 x weight(kg) / 200.
The point is not to minimise your effort, it is to spare you from eating an extra meal out of compensatory illusion. Precision on EAT is the silent condition of any success in a calorie deficit.
The Lean pipeline: BodyScan, patented BMR, MET, adaptation
Lean is the app that computes EAT best for a simple reason: its EAT relies on a BMR personalised on your real bodyfat, not on a 1990 equation pulled from your raw weight. Four steps in a row:
AI BodyScan
You take a photo in the app. The AI estimates your bodyfat from your visible morphology. Redone every week. That measurement is what makes the EAT calculation realistic, because it anchors BMR on lean mass, not on raw weight.
BMR via patented proprietary model
The patented Lean algorithm computes your BMR from your real lean mass. More precise than Harris-Benedict 1919 or Mifflin-St Jeor 1990, which rely on raw weight without knowing your bodyfat.
EAT from MET tables + effective duration
You select your sport (running, cycling, strength training, yoga, swimming, tennis, and 100+ others). You enter the effective effort time, not the time in the gym. Lean applies the reference MET from the Compendium of Physical Activities and computes kcal/min expenditure on your metabolism.
Metabolic adaptation recalculated
During a deficit, BMR drops (metabolic adaptation). Lean is the first app to model that coefficient and apply it multiplicatively to BMR. Convention 100 % = optimal, 90 % = adaptation of 10 points. Your EAT moves with it, automatically.
Concrete result: for a 60-minute strength training session with 35 effective minutes under tension, Lean will display about 220 kcal of EAT for a moderately active 80 kg man. MyFitnessPal or Apple Watch will frequently show 450 to 600 kcal for the same session. The gap is the error, and that gap is what keeps fat loss from working over time.
Free download
EAT FAQ
Is EAT the same thing as « burning calories during sport »?
Why does my Apple Watch systematically overestimate EAT?
Does EAT include strength training, or only cardio?
What is the difference between EAT and NEAT?
Should EPOC (« after-burn ») be counted into EAT?
How many sessions per week to move EAT significantly?
When I run, do my steps count twice (NEAT + EAT)?
My strength training session only burns 200 to 300 kcal, is that normal?
So is strength training useless for cutting?
References
- Ainsworth B.E. et al. (2011). Compendium of Physical Activities: a second update of codes and MET values. Med Sci Sports Exerc. PubMed 21681120.
- Shcherbina A. et al. (2017). Accuracy in Wrist-Worn, Sensor-Based Measurements of Heart Rate and Energy Expenditure in a Diverse Cohort. J Pers Med. Stanford Medicine News, 2017.
- HowdyHealth, Texas A&M (2023). Use Metabolic Equivalents (METs) to Calculate Calories Burned. howdyhealth.tamu.edu.
- Westcott W.L. (2012). Resistance training is medicine: effects of strength training on health. Curr Sports Med Rep. PubMed 22653269.
- Mifflin M.D. et al. (1990). A new predictive equation for resting energy expenditure in healthy individuals. Am J Clin Nutr. PubMed 2305711.
- Harris J.A., Benedict F.G. (1919). A Biometric Study of Basal Metabolism in Man. Carnegie Institution of Washington.
- Westerterp K.R. (2004). Diet induced thermogenesis. Nutr Metab. PubMed 15282028.
- Müller M.J., Bosy-Westphal A. (2013). Adaptive thermogenesis with weight loss in humans. Obesity. PubMed 23404923.
- Schoeller D.A. (1988). Measurement of energy expenditure in free-living humans by using doubly labeled water. J Nutr. PubMed 3138331.
- Levine J.A. (2007). Nonexercise activity thermogenesis (NEAT): environment and biology. Am J Physiol Endocrinol Metab. PubMed 15102614.
- Hector A.J., Phillips S.M. (2018). Protein Recommendations for Weight Loss in Elite Athletes. J Int Soc Sports Nutr. jissn.biomedcentral.com.
- Frankenfield D.C. et al. (2013). Validation of Mifflin-St Jeor equation in obese and non-obese populations. J Am Diet Assoc. PubMed 23631843.
- Katch V.L., McArdle W.D. (1973). Prediction of body density from simple anthropometric measurements in college-age men and women. Hum Biol.
- Speakman J.R. (2004). Doubly Labelled Water: Theory and Practice. Springer.
- Borg G.A.V. (1982). Psychophysical bases of perceived exertion. Med Sci Sports Exerc. PubMed 7154893.
- Tudor-Locke C. et al. (2011). How many steps/day are enough? Int J Behav Nutr Phys Act. PubMed 21798015.
- LaForgia J., Withers R.T., Gore C.J. (2006). Effects of exercise intensity and duration on the excess post-exercise oxygen consumption. J Sports Sci. PubMed 17101527.
- Cunningham J.J. (1980). A reanalysis of the factors influencing basal metabolic rate in normal adults. Am J Clin Nutr. PubMed 7435418.
- Donnelly J.E. et al. (2009). Appropriate physical activity intervention strategies for weight loss. Med Sci Sports Exerc. PubMed 19127177.
- Wing R.R., Hill J.O. (2001). Successful weight loss maintenance. Annu Rev Nutr. PubMed 11375434.
- Pontzer H. et al. (2016). Constrained Total Energy Expenditure and Metabolic Adaptation to Physical Activity in Adult Humans. Curr Biol. PubMed 26832439.
- Compendium of Physical Activities, version 2024. Arizona State University. pacompendium.com.
- Trost S.G. et al. (2014). Comparison of accelerometer cut points for predicting activity intensity. Med Sci Sports Exerc. PubMed 24500855.