How to count your calories without it taking over your life. The 4 methods compared, their real accuracy, and the one you will still be using in 6 months.
AI photo scan, barcode, food database, quick add: what each method is really worth, why 80% of people quit within 3 months, and how to choose for your profile.
 The Lean Team · 11 min read · Updated June 11, 2026

 Free download
Four methods to count your calories: the AI photo scan (you photograph your plate, the AI identifies every food and its quantity), the barcode scan (packaged products, manufacturer data), the database (search + weighing, the most precise mode) andquick add (a global envelope in 10 seconds). The right method is the one you will stick with for 6 months, not the most precise on paper. And counting what goes in only helps if your expenditure, your TDEETotal Daily Energy Expenditure: your total calorie expenditure over 24 h. TDEE = BMR + NEAT + EAT + TEF., is calculated right.
Why 80% of people quit counting within 3 months
Counting calories works. That is not the issue. The issue is that almost nobody sticks with it: studies on weight-loss programs show massive attrition within the first weeks, well before the first visible result on the scale.
The friction, concretely: searching “chicken breast” in a list, picking the right entry among 40 duplicates, eyeballing 150 g, starting over for the beans, then for the olive oil. Three times a day. 90 times a month. That bookkeeping is what kills tracking, not the idea of tracking.
Practical conclusion: the choice of your logging method is not an ergonomic detail. It is THE variable that decides whether your data will still exist in 3 months. Here are the 4 methods, ranked from fastest to most demanding.
The AI photo scan: 5 seconds per meal
You take a photo of your plate. Lean’s AI runs a double identification : first it recognizes every food present (grilled chicken, green beans), then it estimates the quantity of each. The result is not one global number out of a hat: it is a food-by-food breakdown, with calories and macros for every line.
In pictures, step by step, on a real meal:
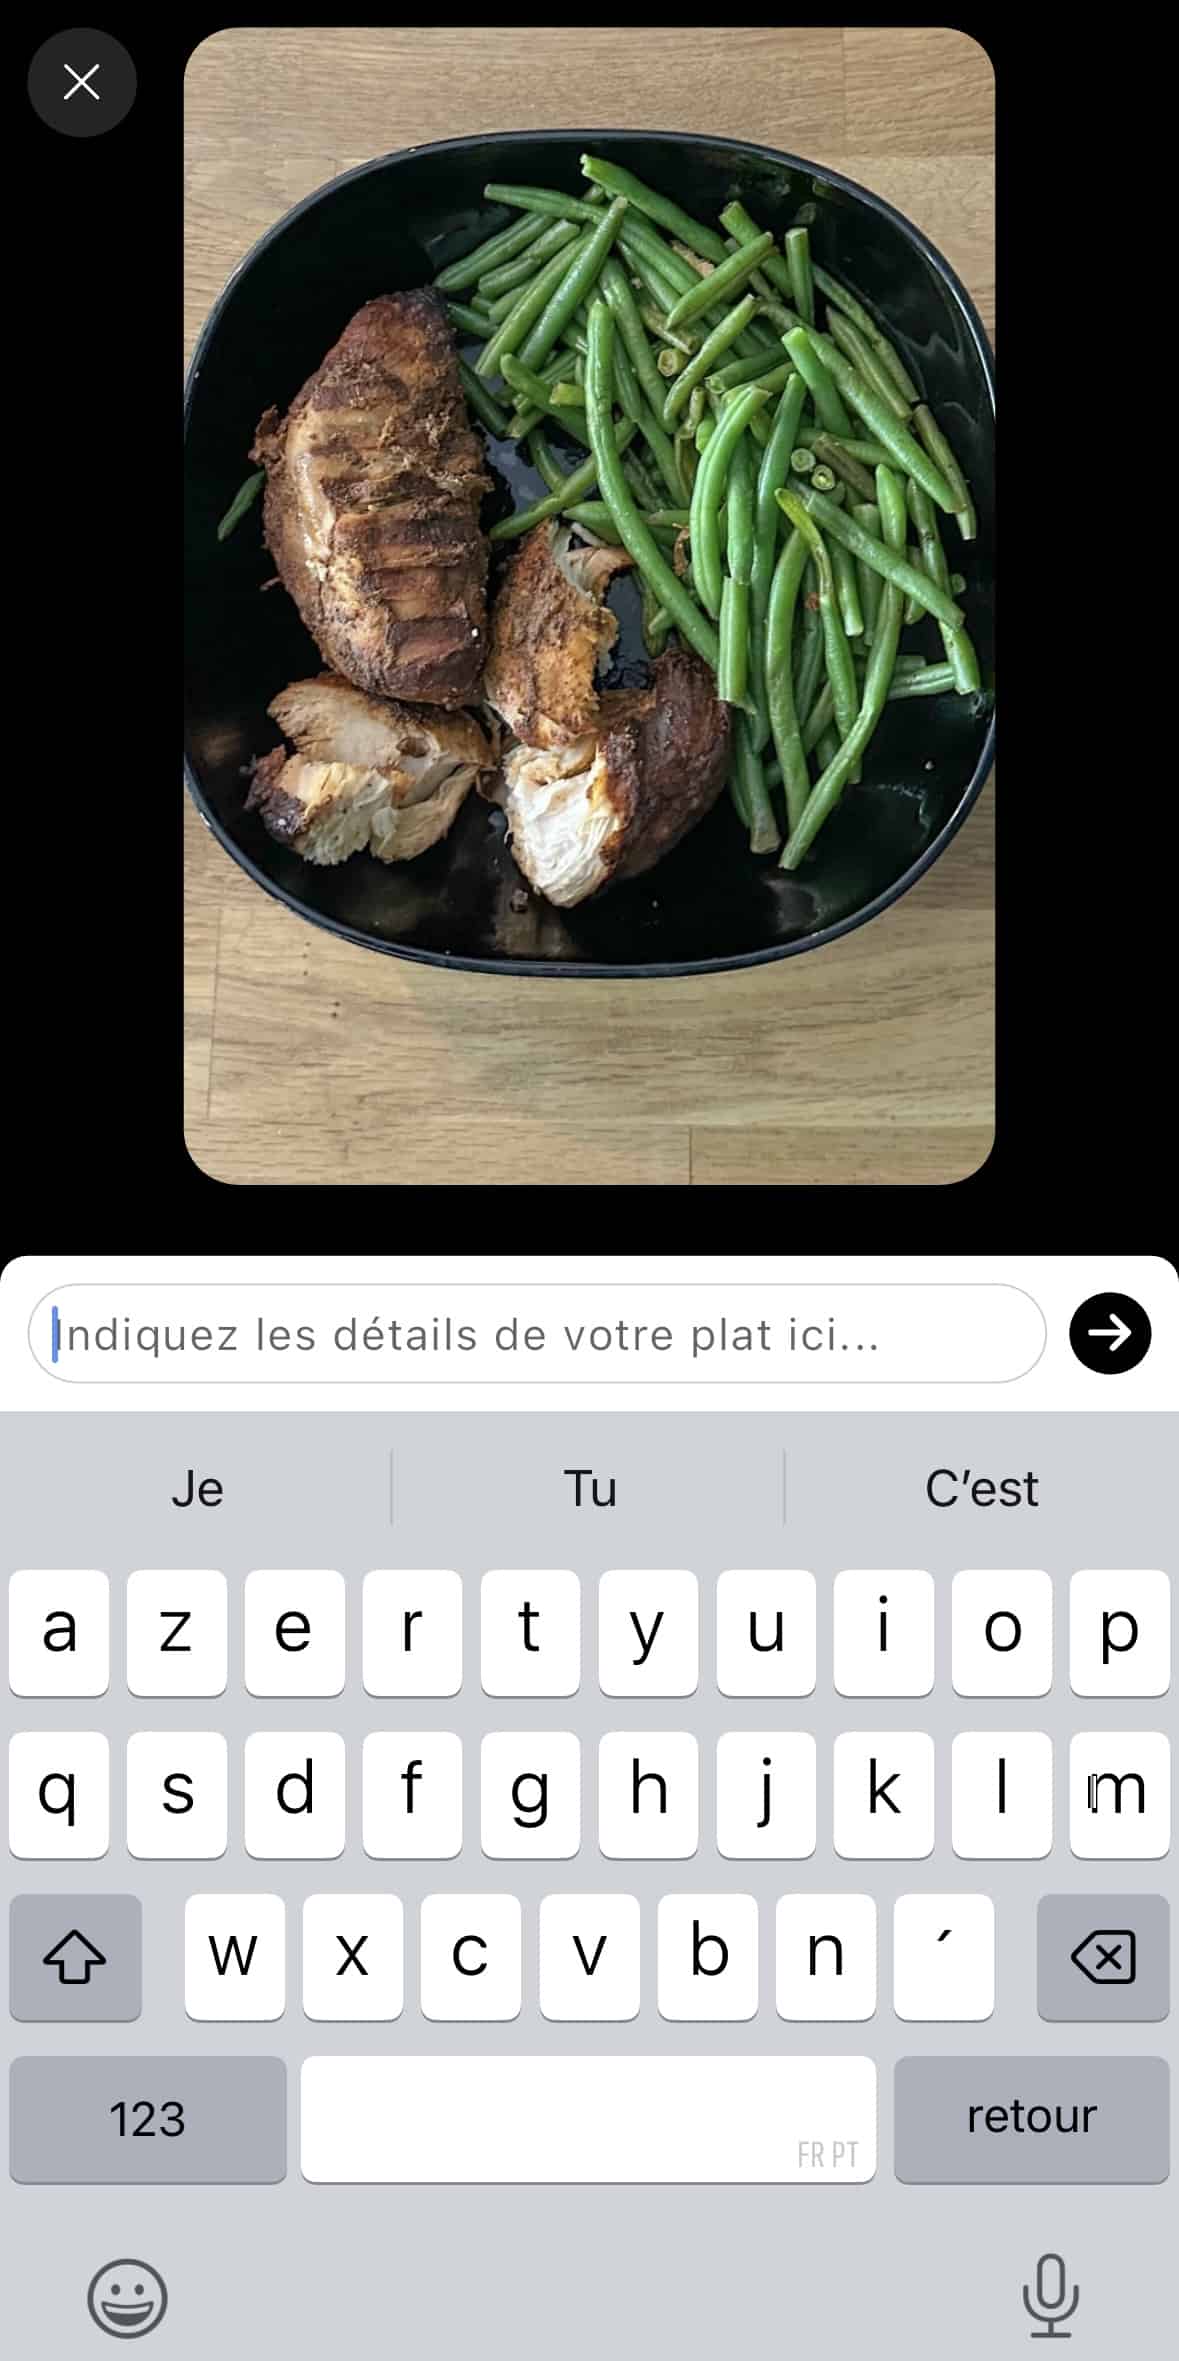
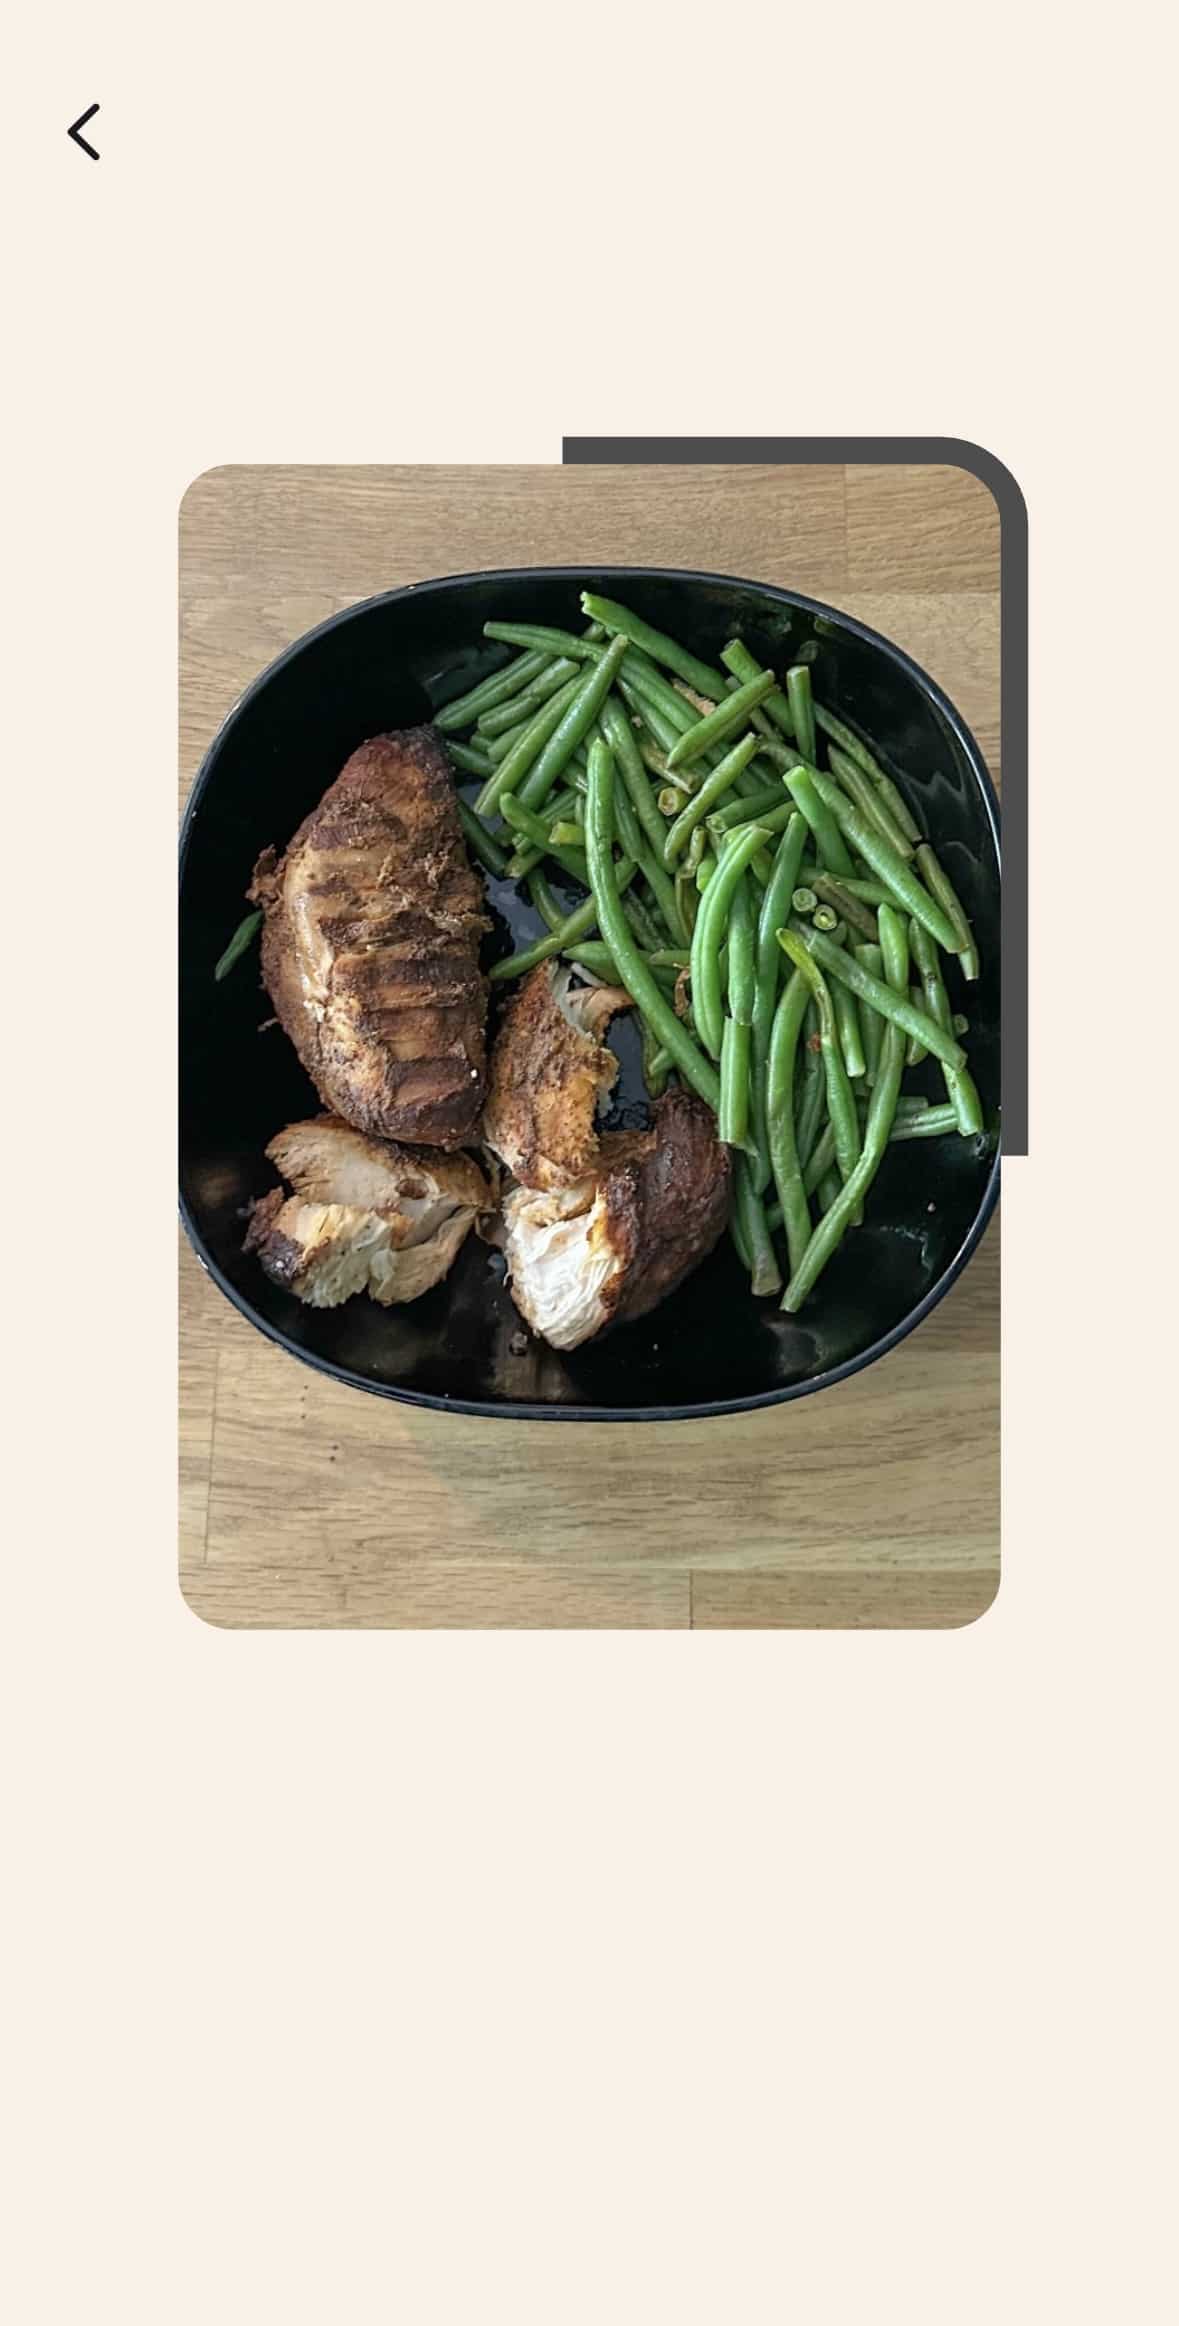
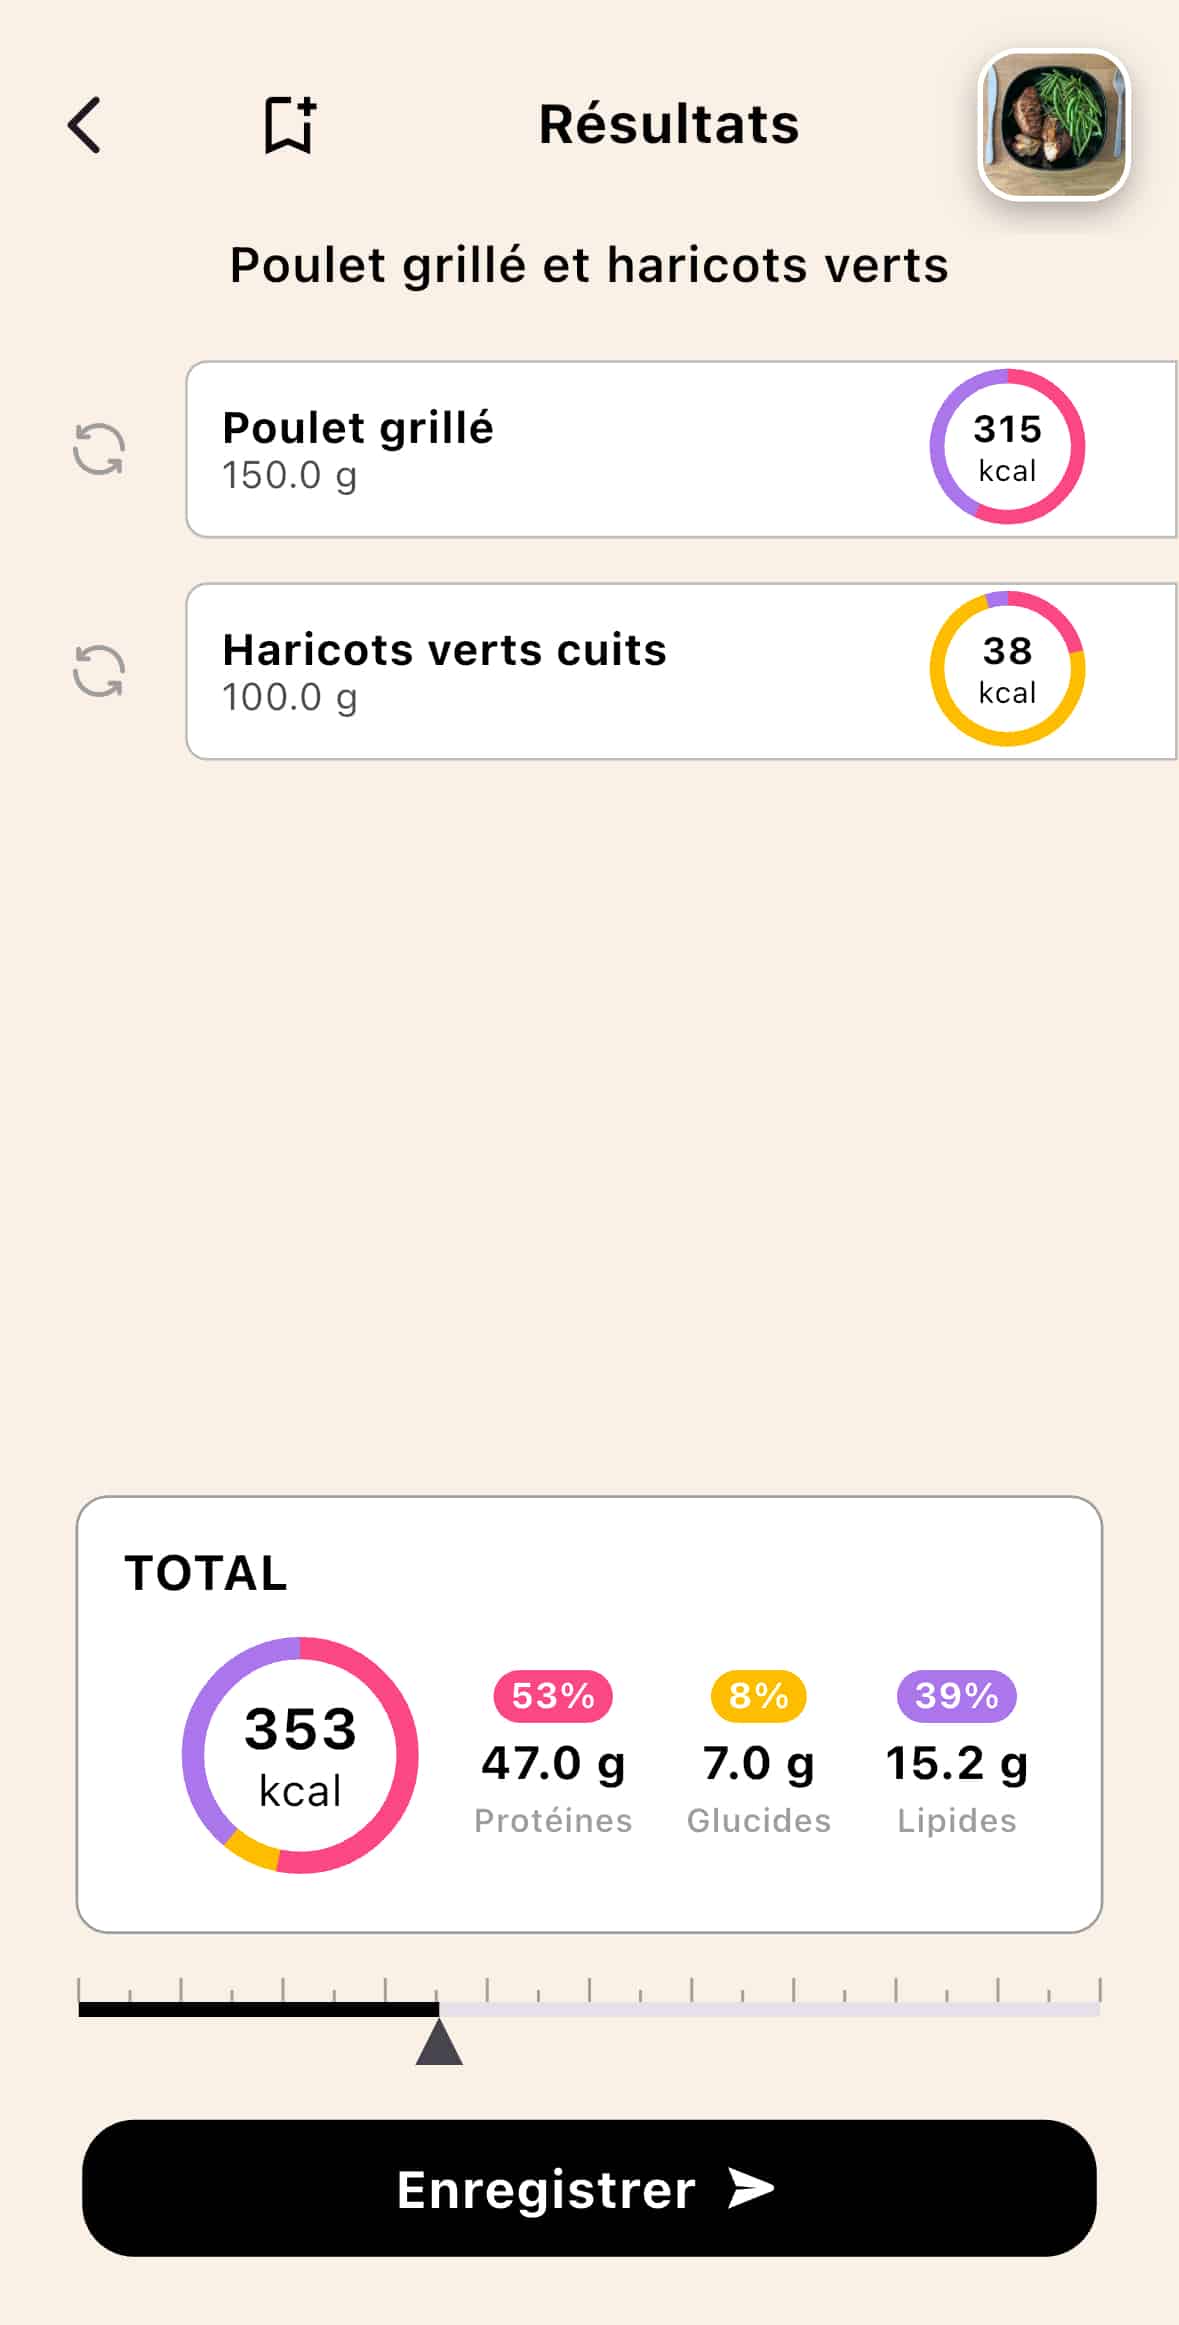
On everyday dishes, the typical error is around ±10% per meal. Less precise than a scale, and largely enough to drive fat loss (we come back to this with the law of large numbers below). Above all, it is the only method that covers meals without a label: home, restaurant, cafeteria.
Where Lean goes further: you stay in control
An AI scan is only useful if you can correct what it suggests. Lean gives you three levers, per food:
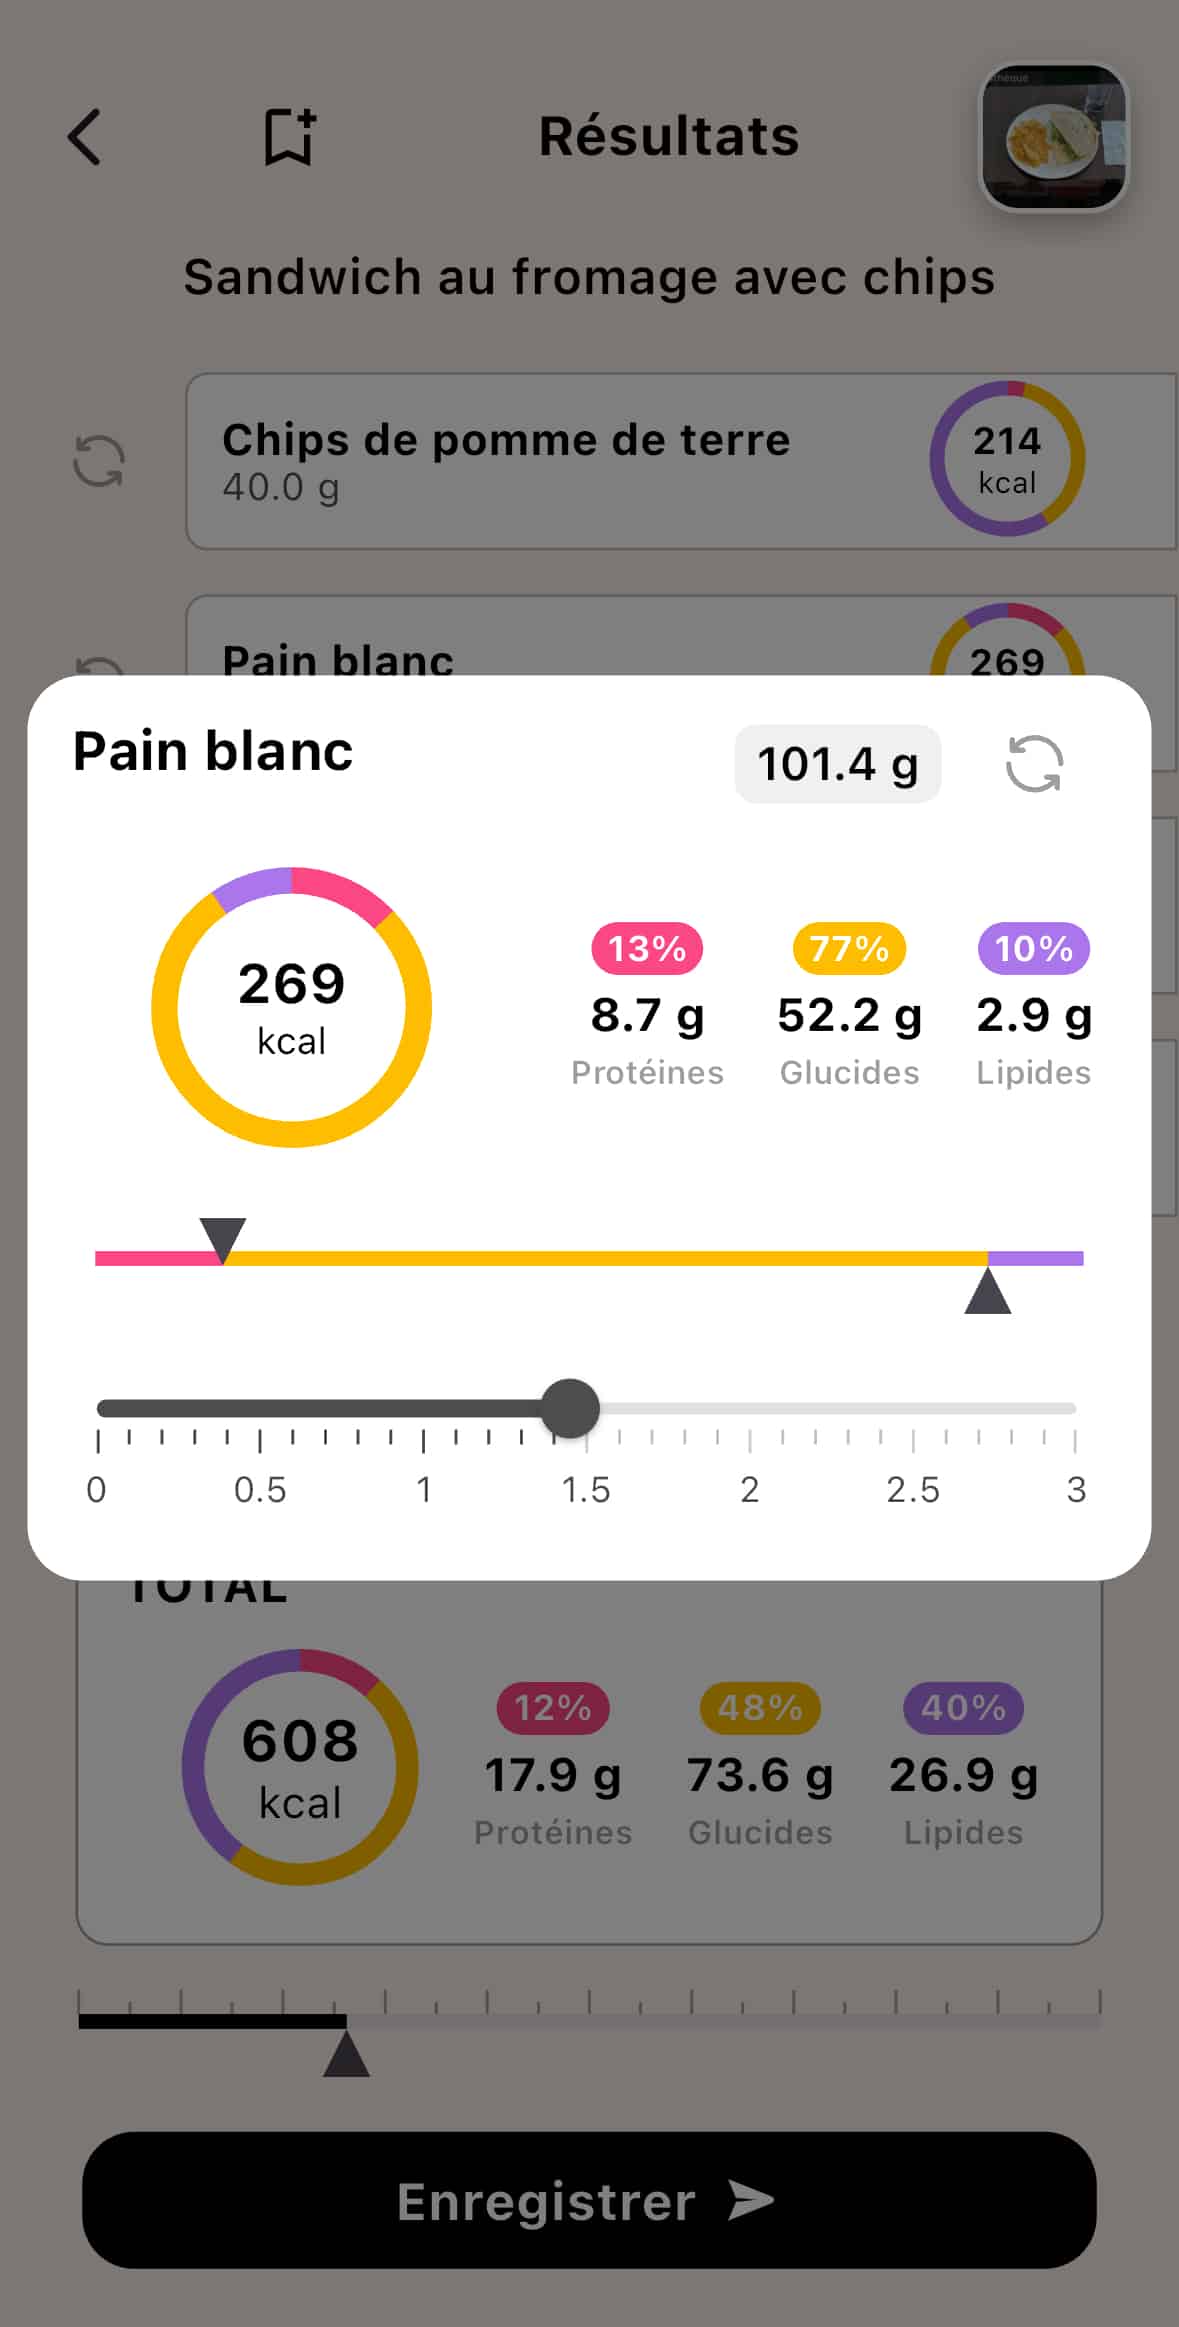
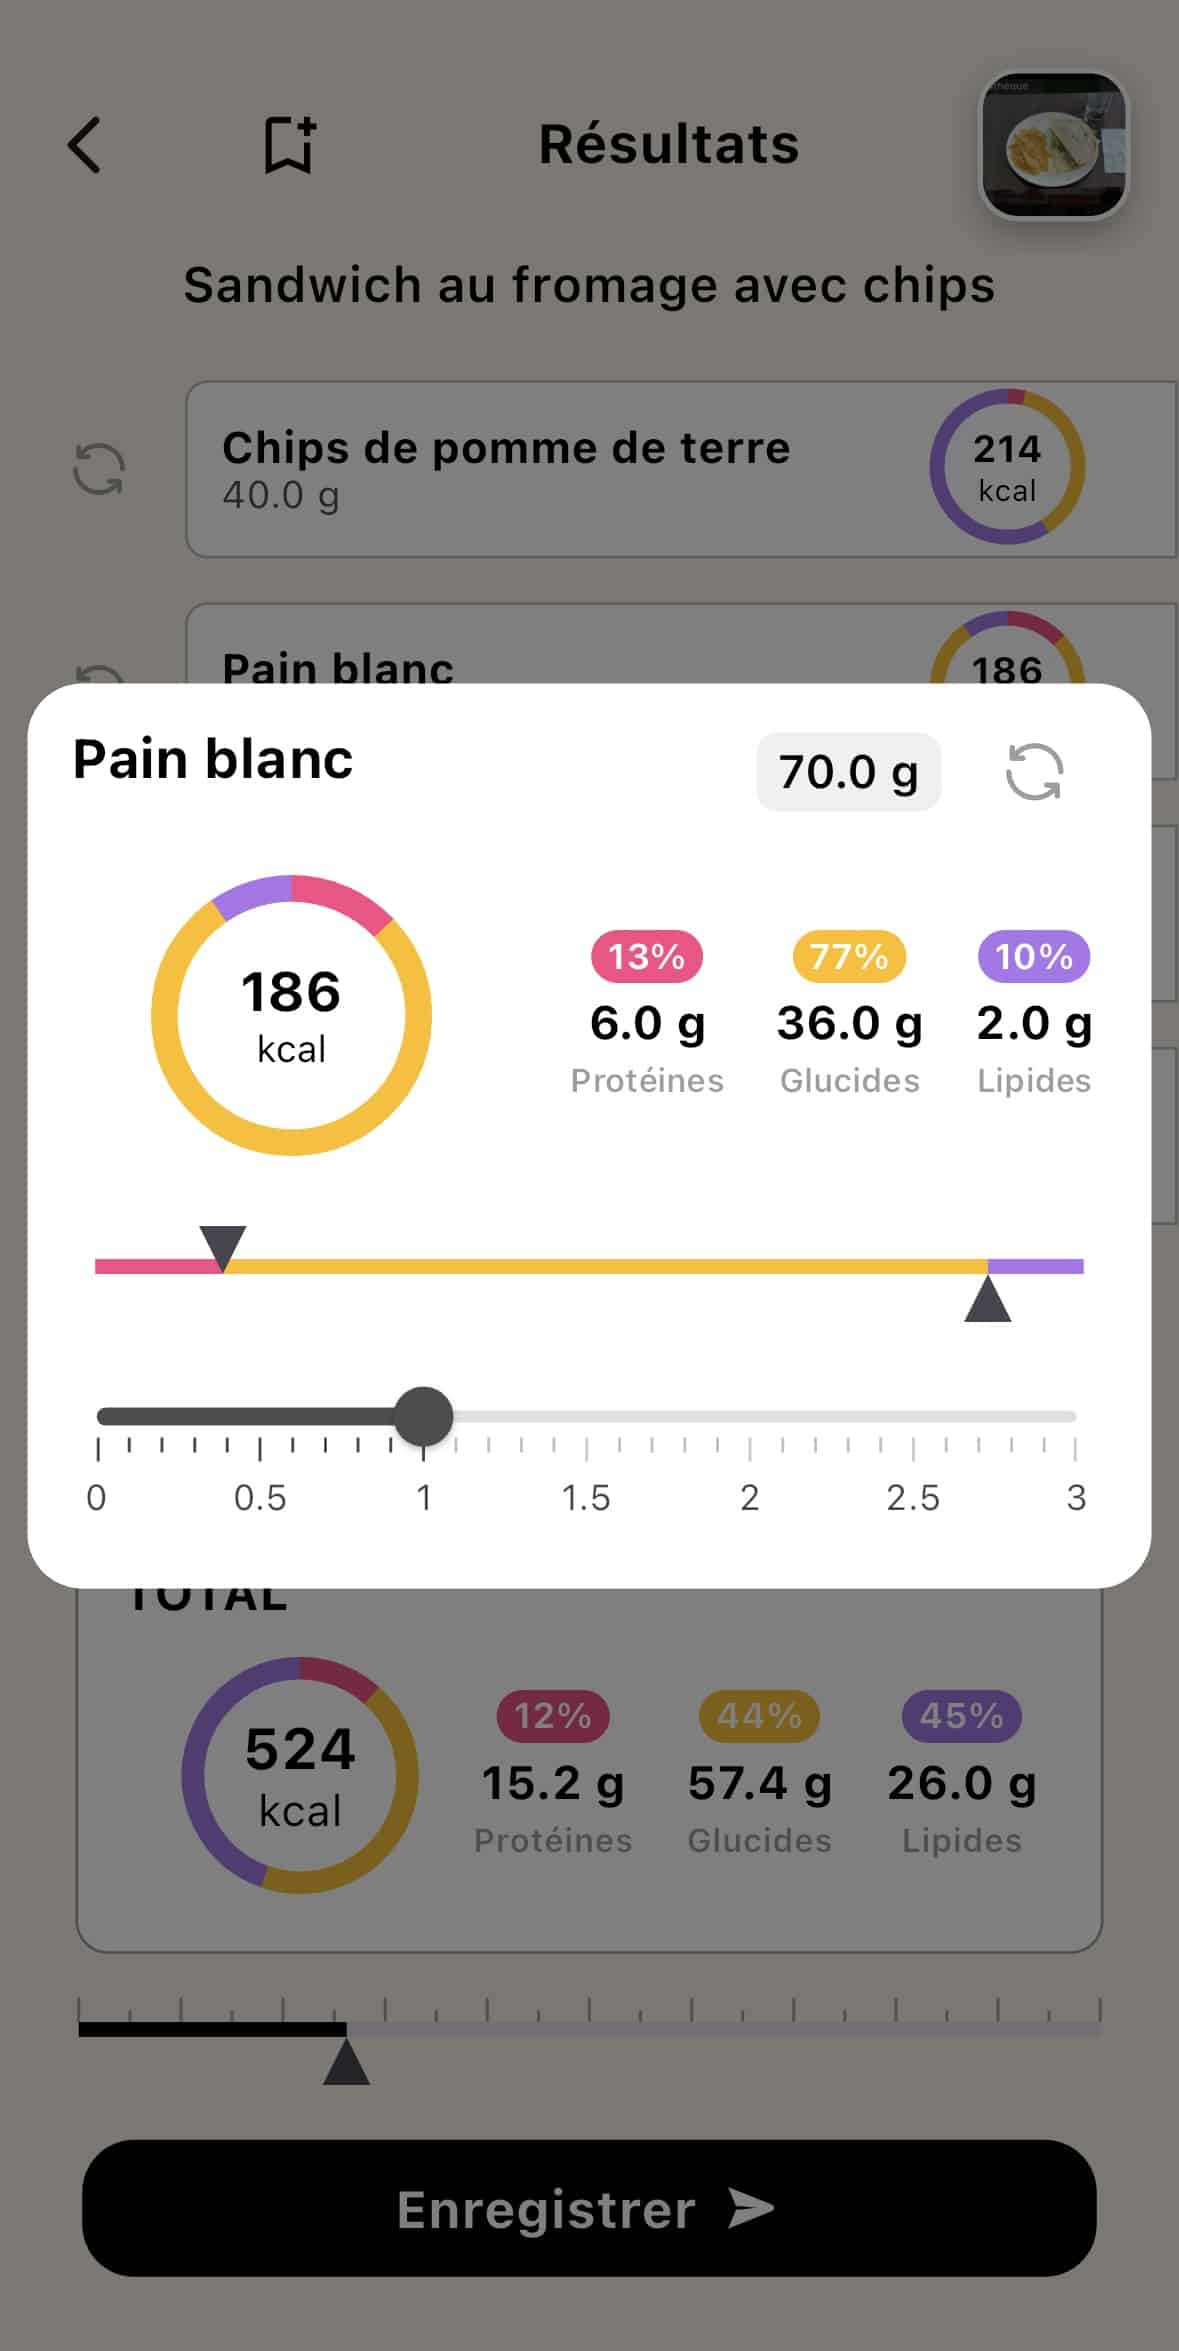
Edit the quantities
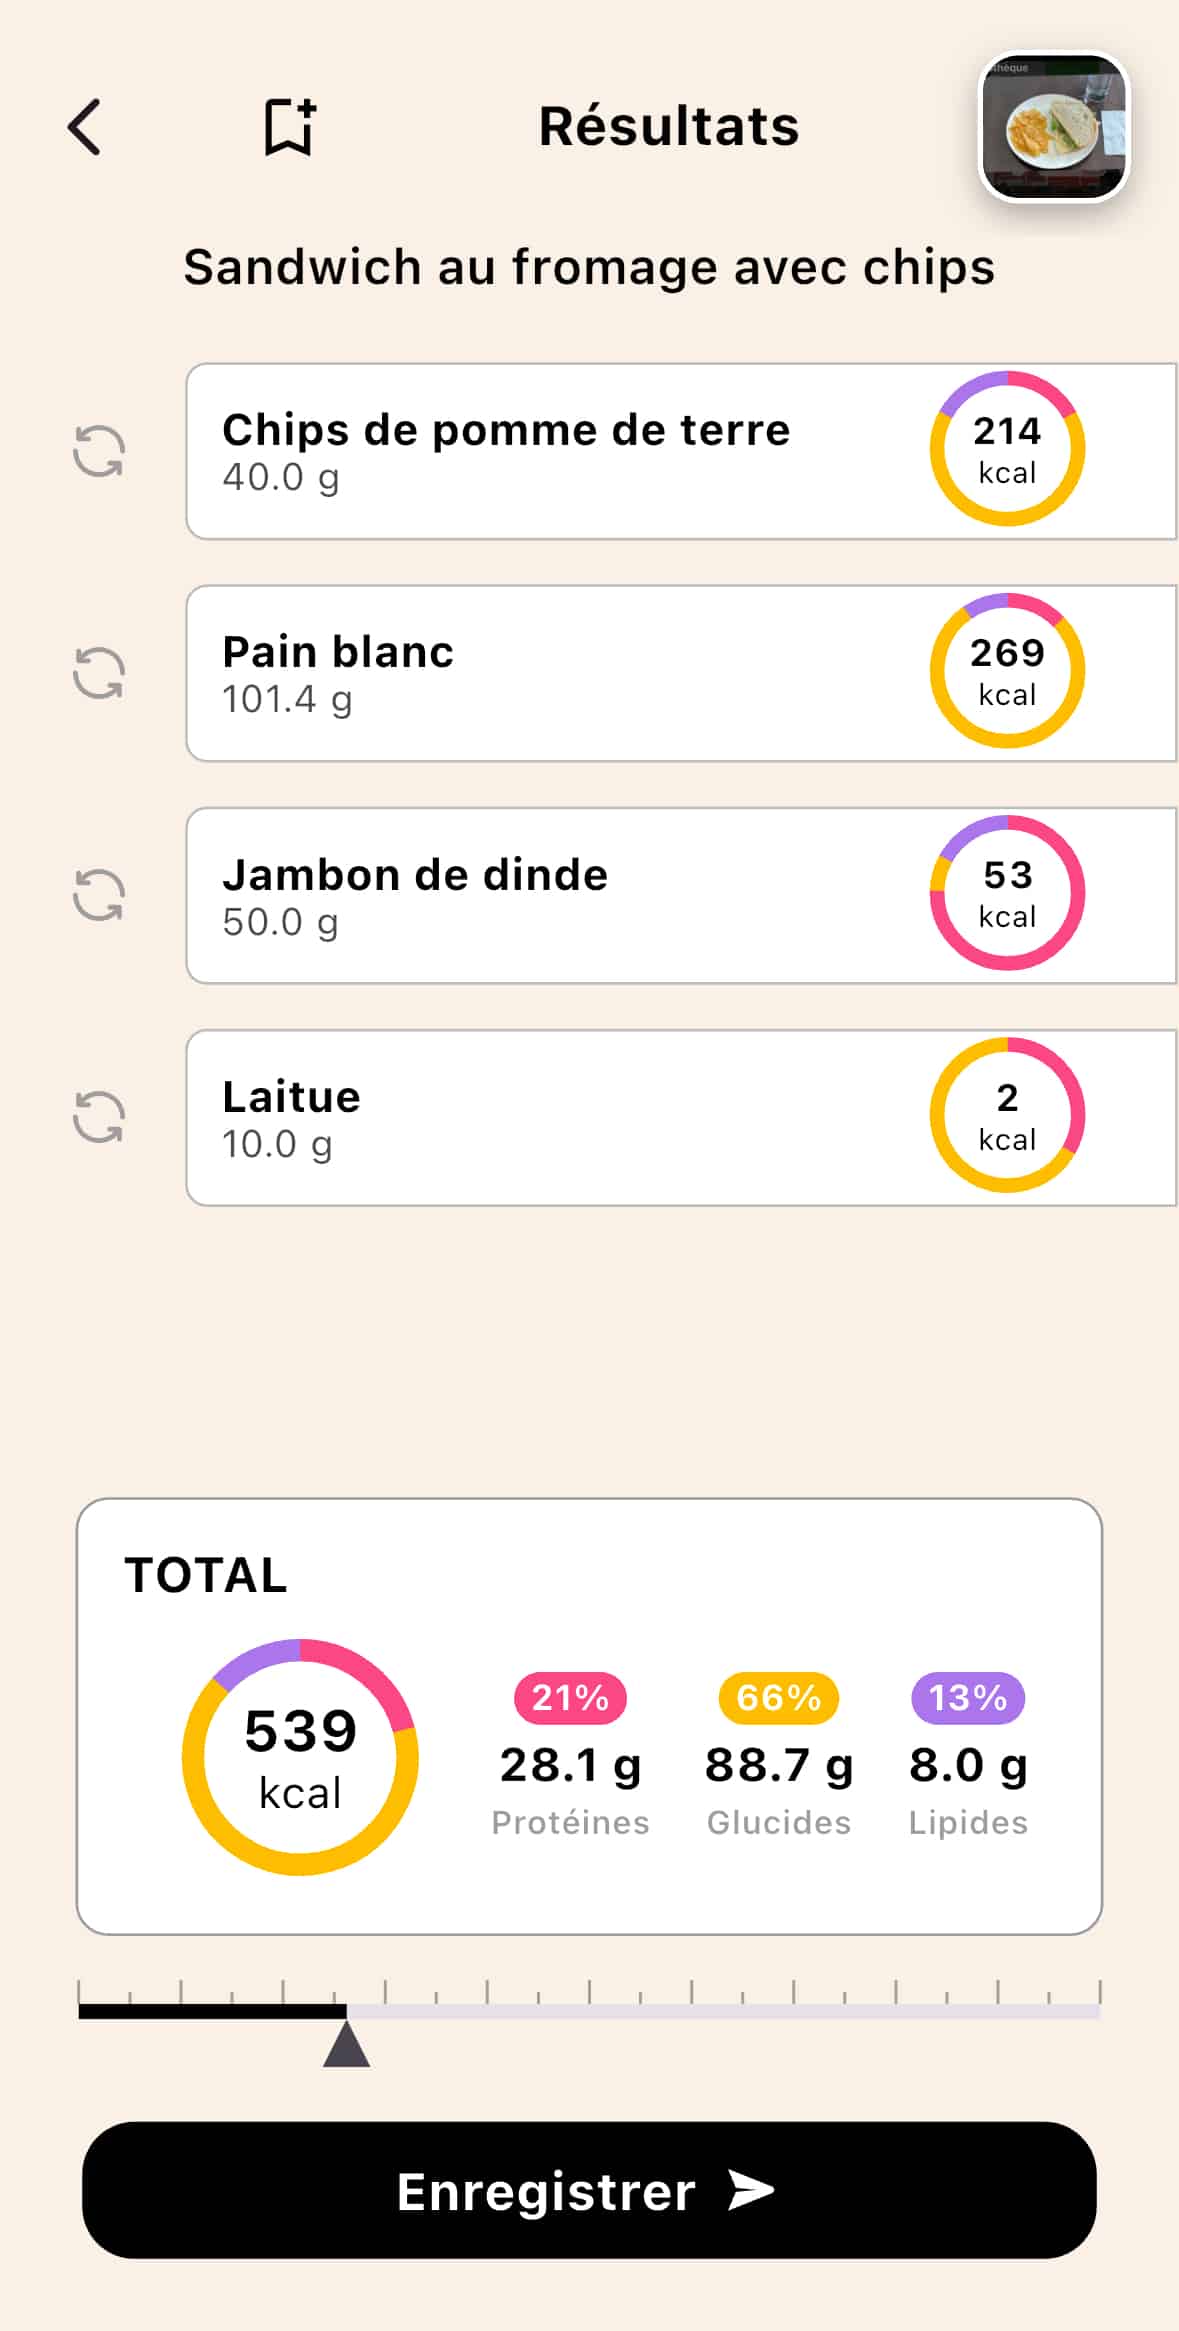
One slider per food: here, bread estimated at 101.4 g by the AI, corrected to 70 g. Calories and dish total recalculate instantly.
Edit the macros
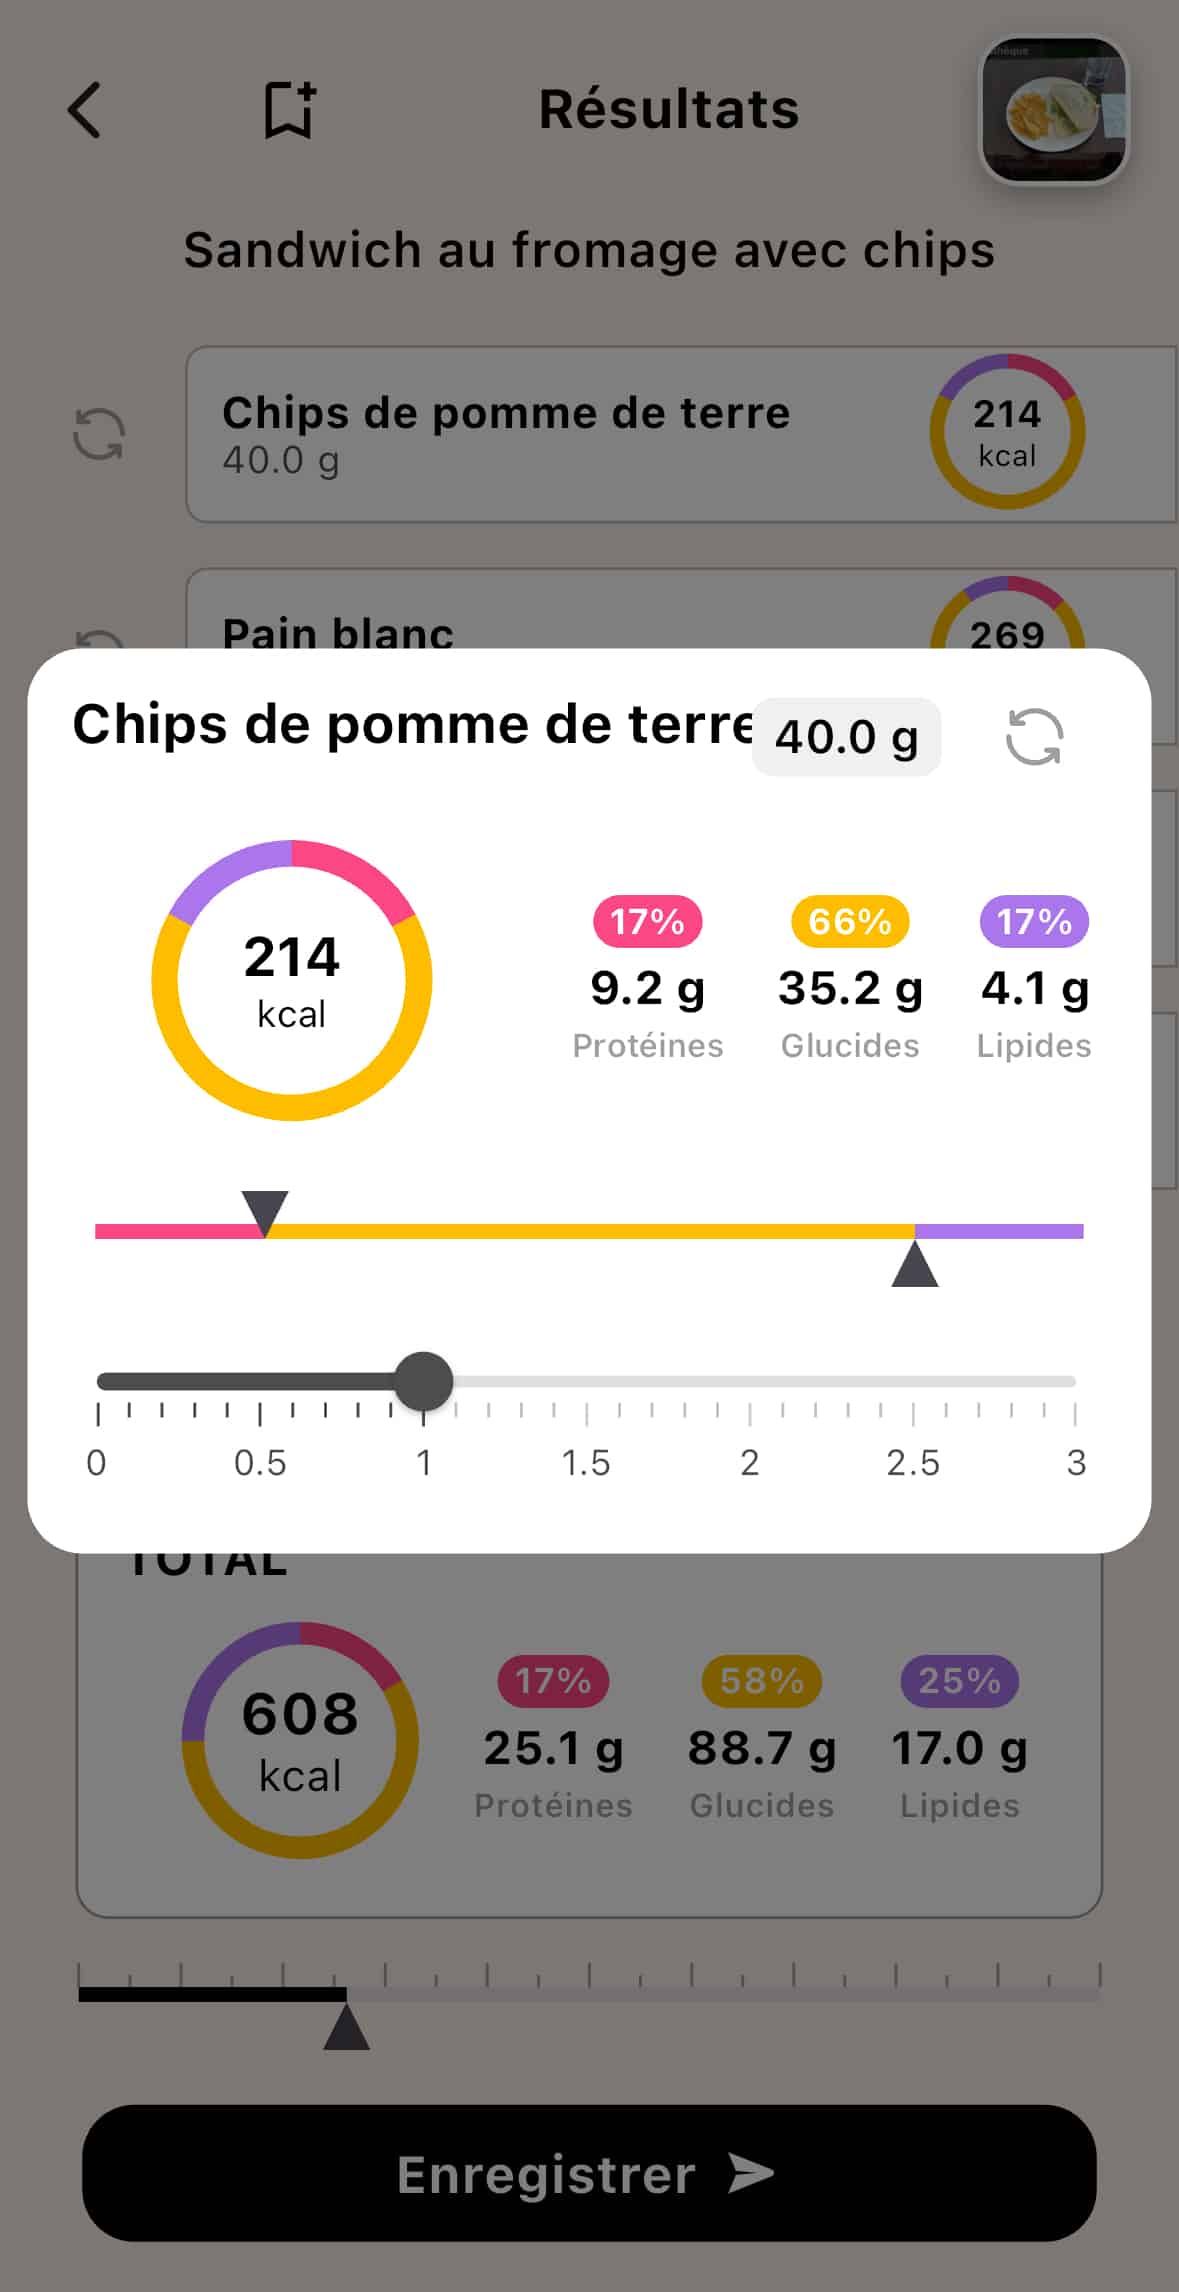
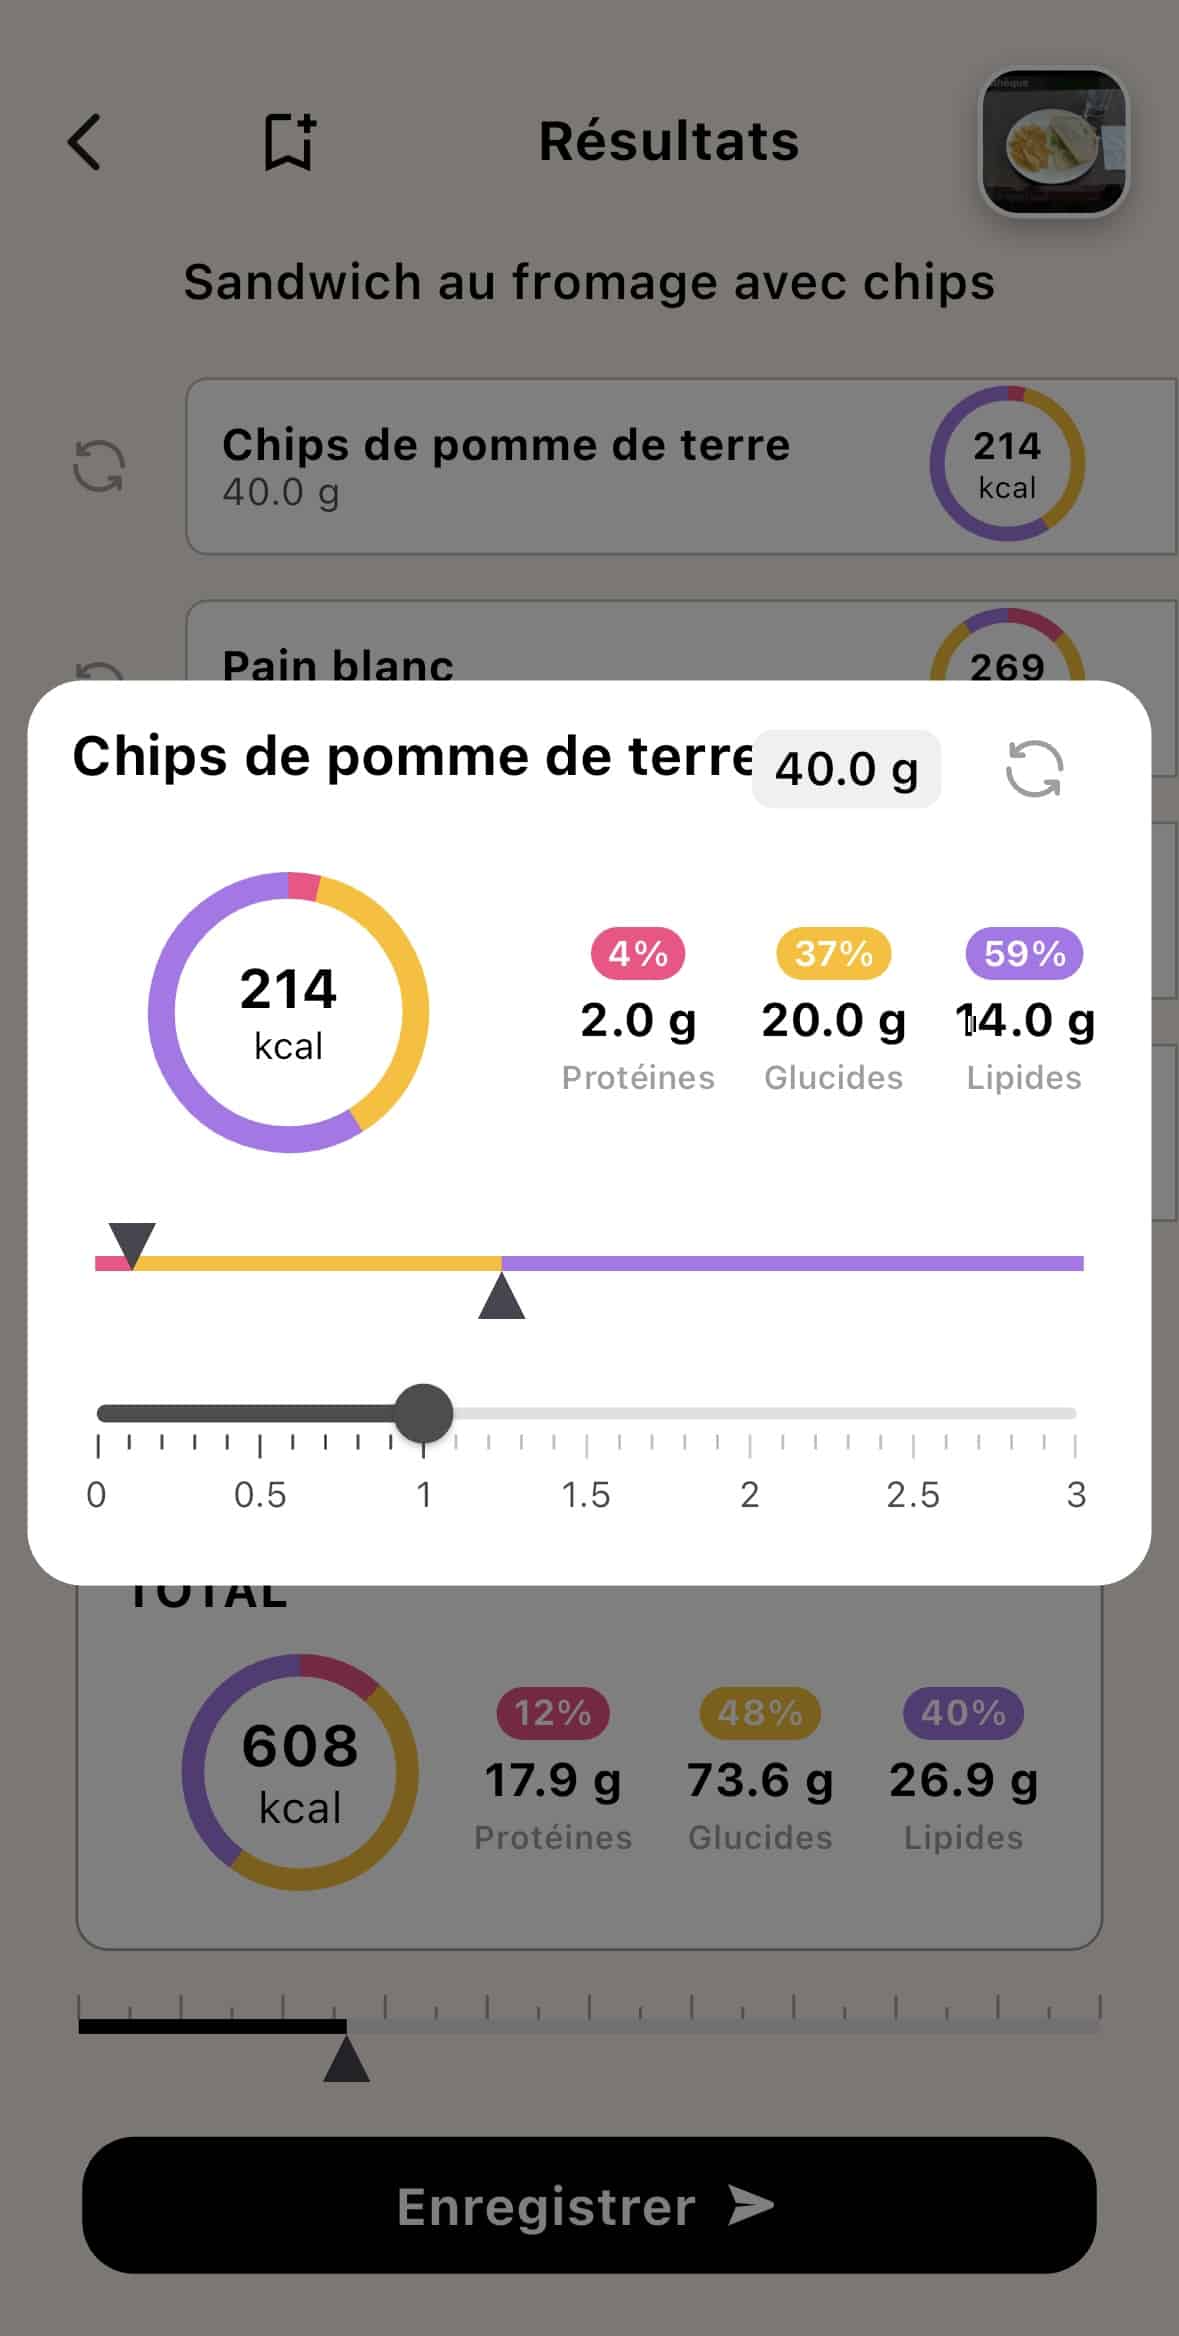
You know your recipe better than the average? Here, the chips: the AI suggests 4.1 g of fat, you correct to 14 g. Donut and total follow.
Re-scan a single food
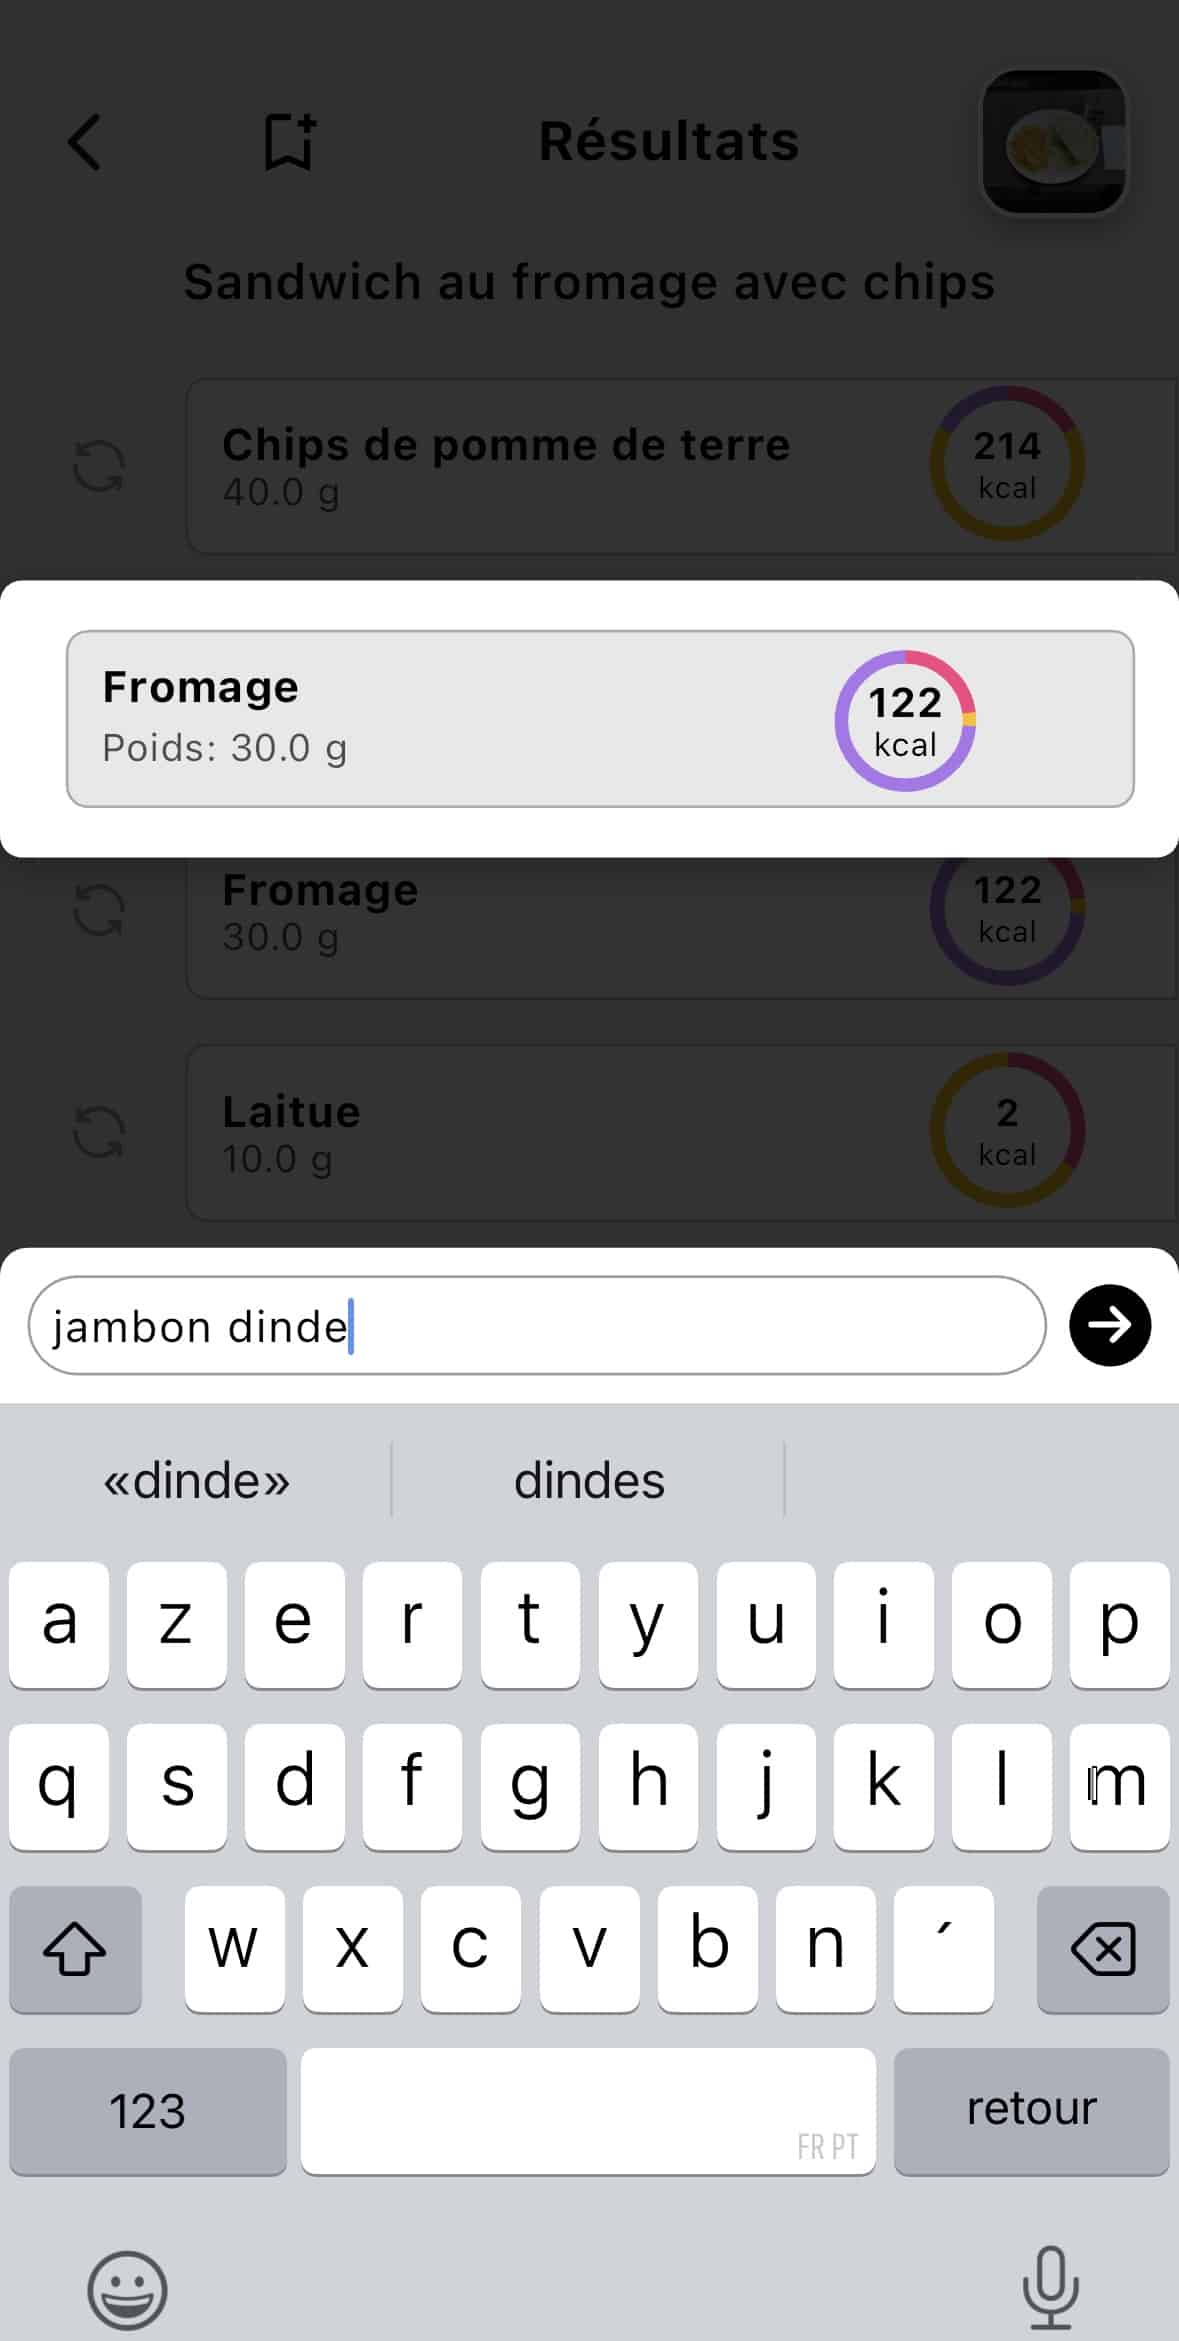
The AI mistook turkey for cheese? You type the right name, the line re-analyzes itself, without redoing the whole dish.
The test against Cal AI: breakdown versus envelope
Same photo, two apps. The difference is plain to see:

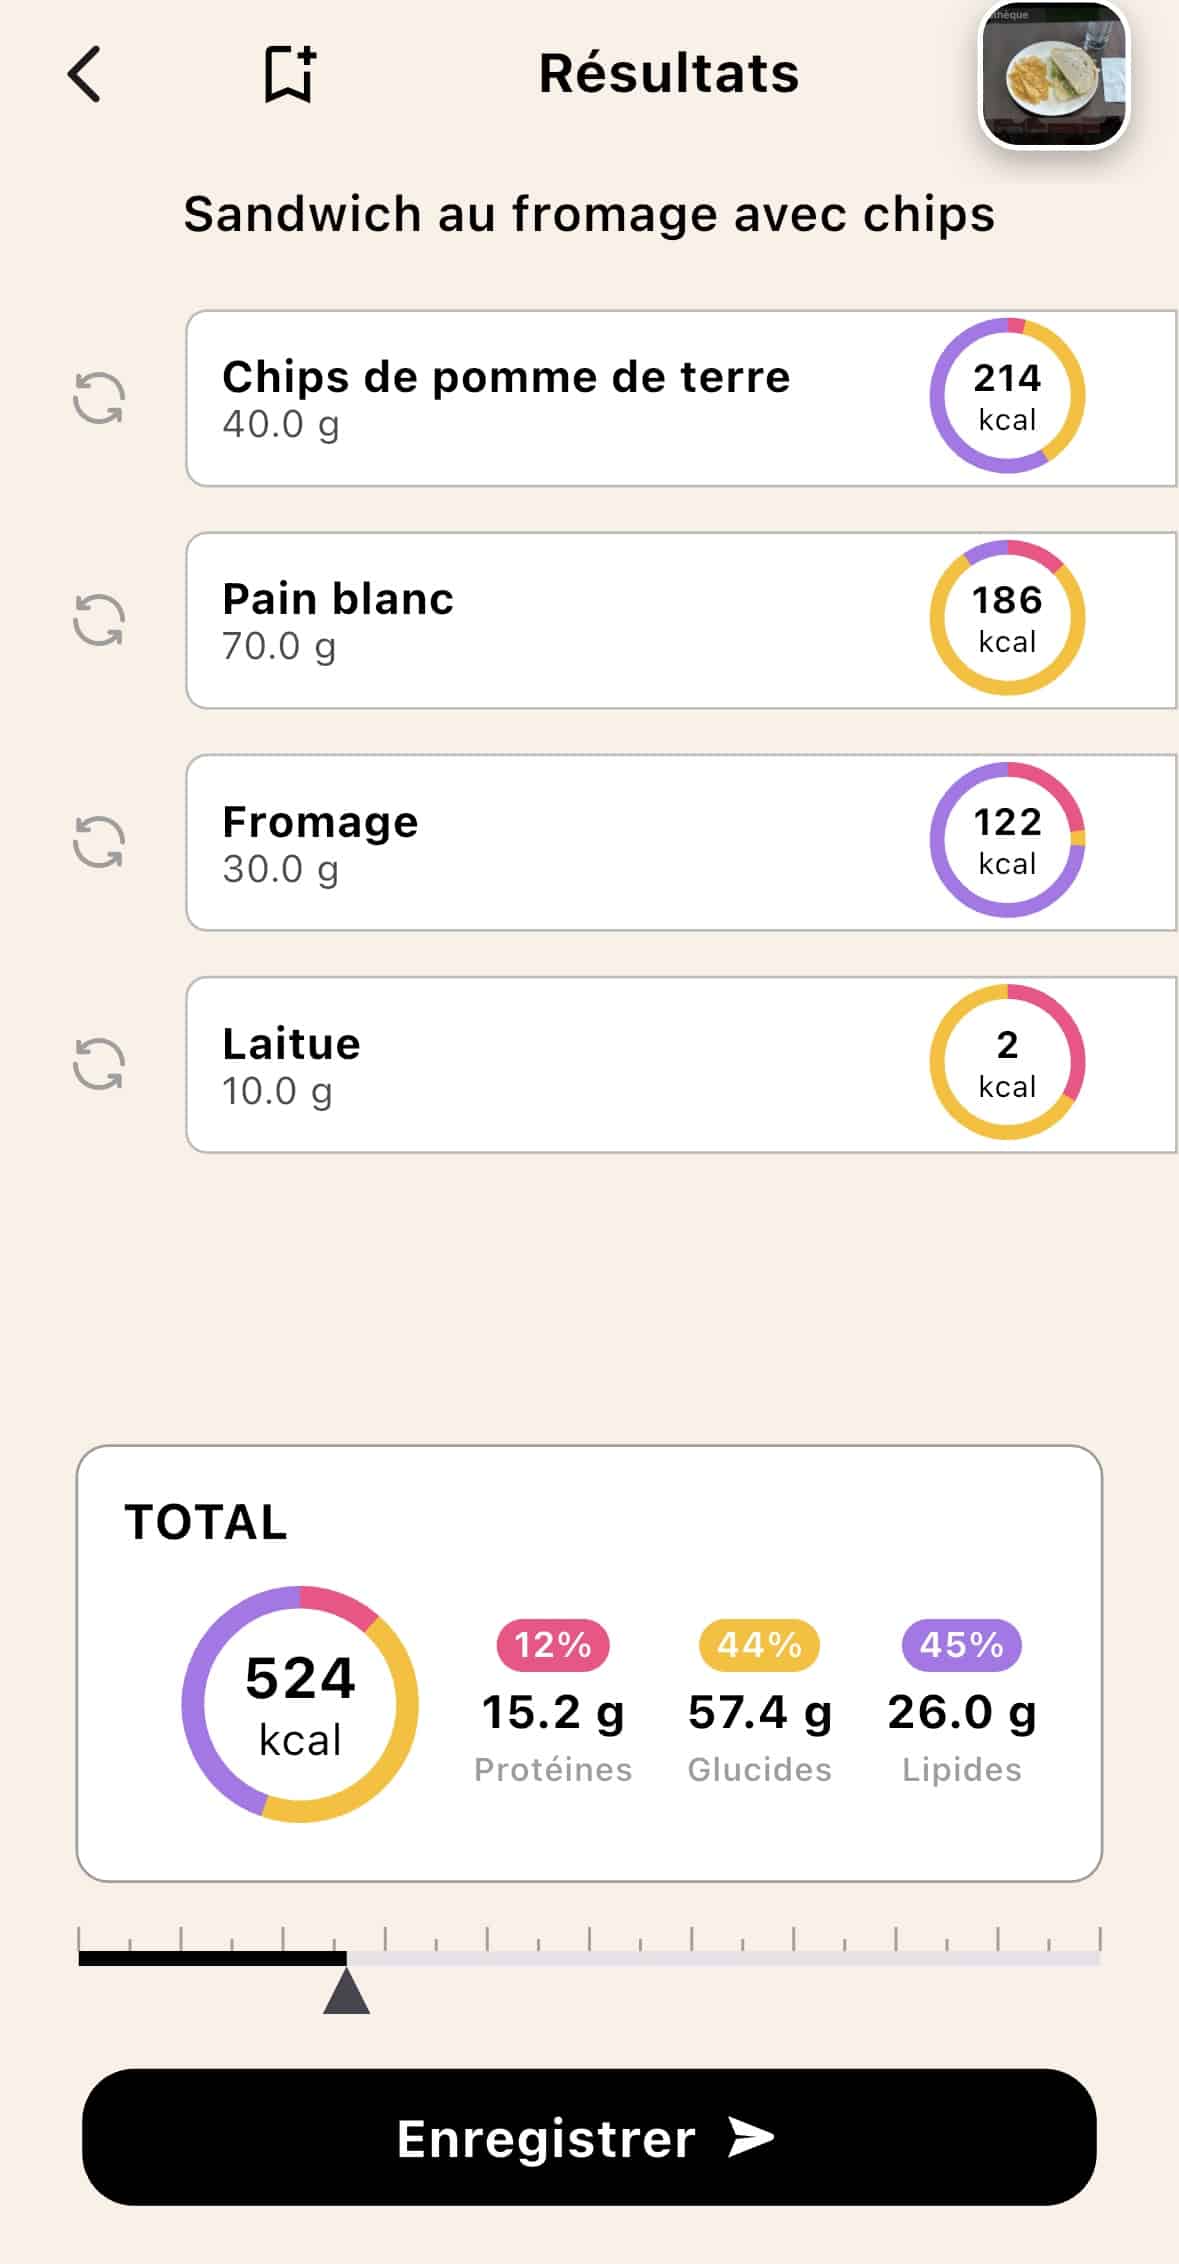
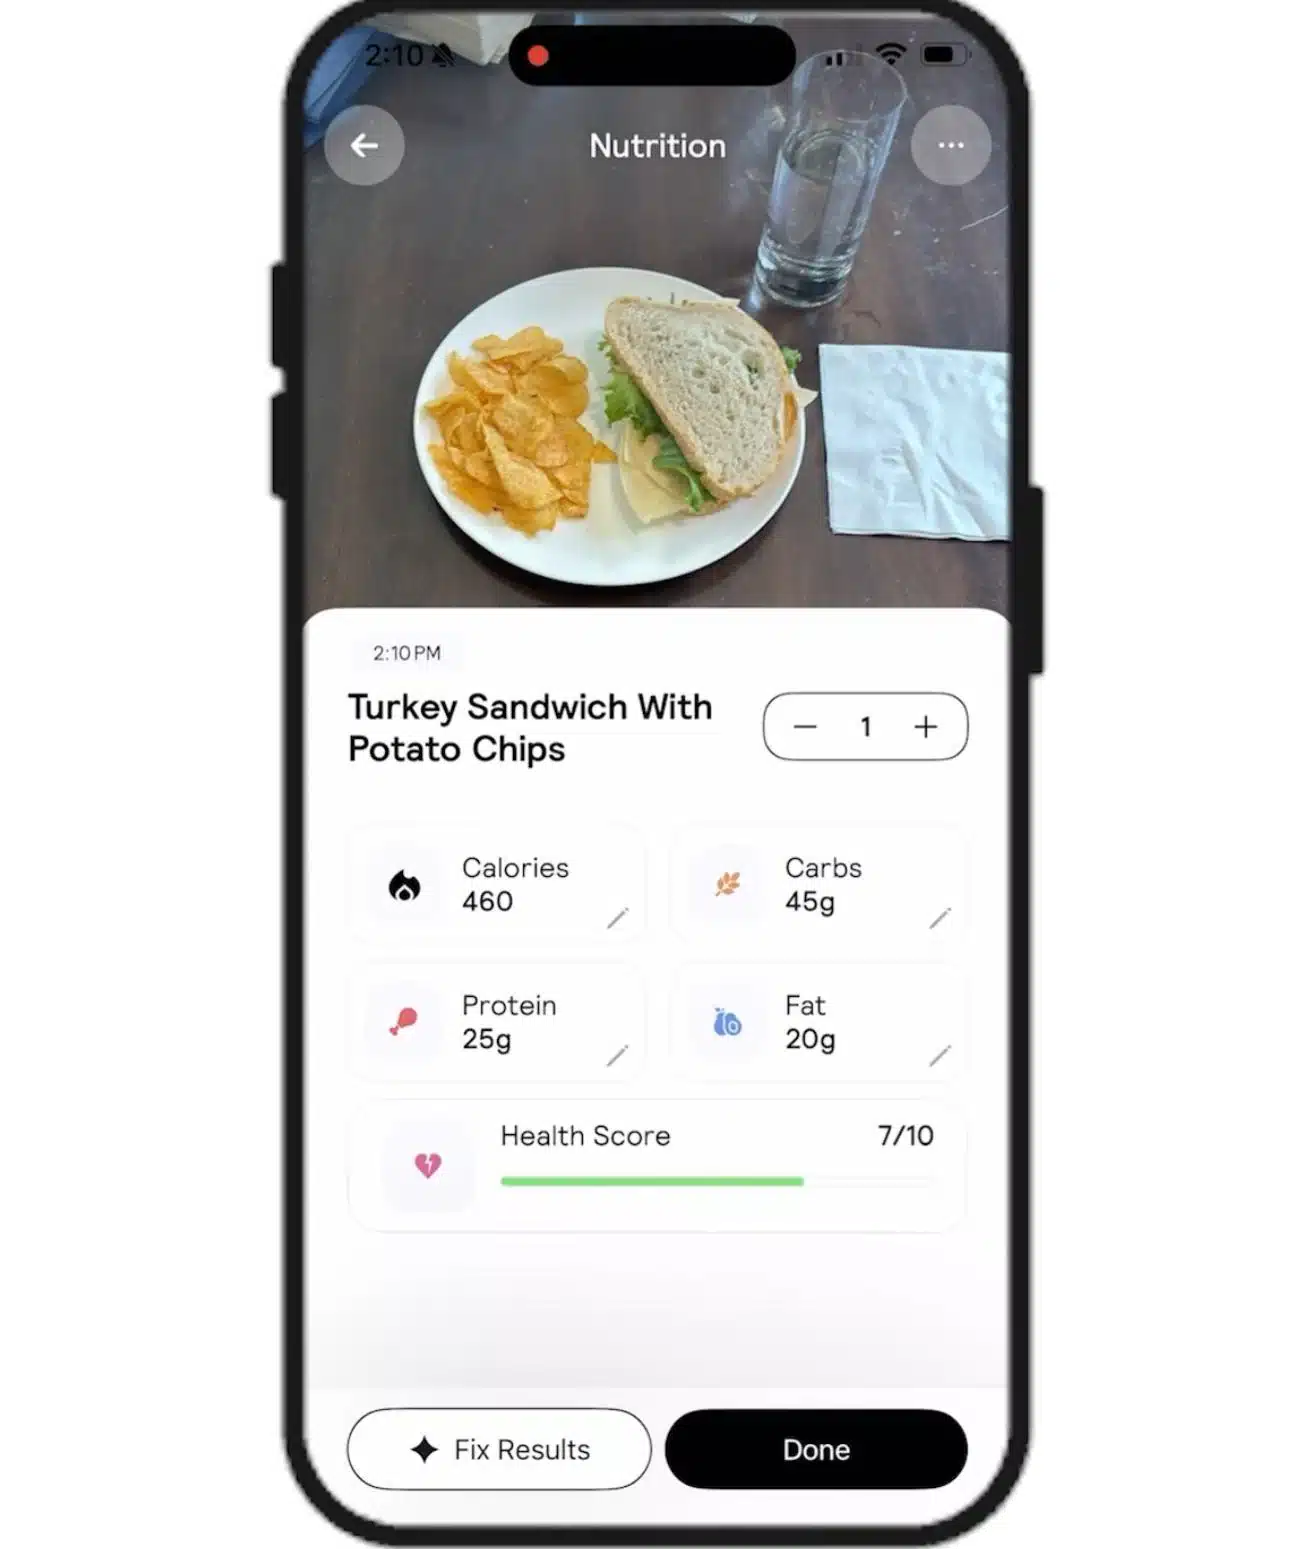
That is the structural difference with most scanning apps, Cal AI first among them: they return one single overall value, per dish, one total of calories and macros with no editable food-by-food breakdown. If the estimate is wrong, you take it or you toss it. With a food-by-food breakdown, the error gets fixed in two taps.
The right use: home-cooked meals, restaurants, cafeterias, every meal without a barcode. The default method for 90% of meals.
Barcode scan: label-grade precision
For anything that comes out of a package, the barcode is unbeatable: nutrition values come straight from manufacturer data. Lean relies on the USDA and OpenFoodFacts databases, millions of references. You scan, you adjust the quantity, done.
The limit is obvious: your homemade plate of pasta has no barcode. That is why this method naturally combines with the AI photo scan; it does not replace it.
The right use: groceries, snacks, processed products, shakers. Maximum precision on packaged food, zero effort.
Database + scale: precision mode
The historical method: you weigh your food, look it up in the database, enter the grams. With a kitchen scale, it is the most precise method there is, the one used for competition prep and clinical protocols.
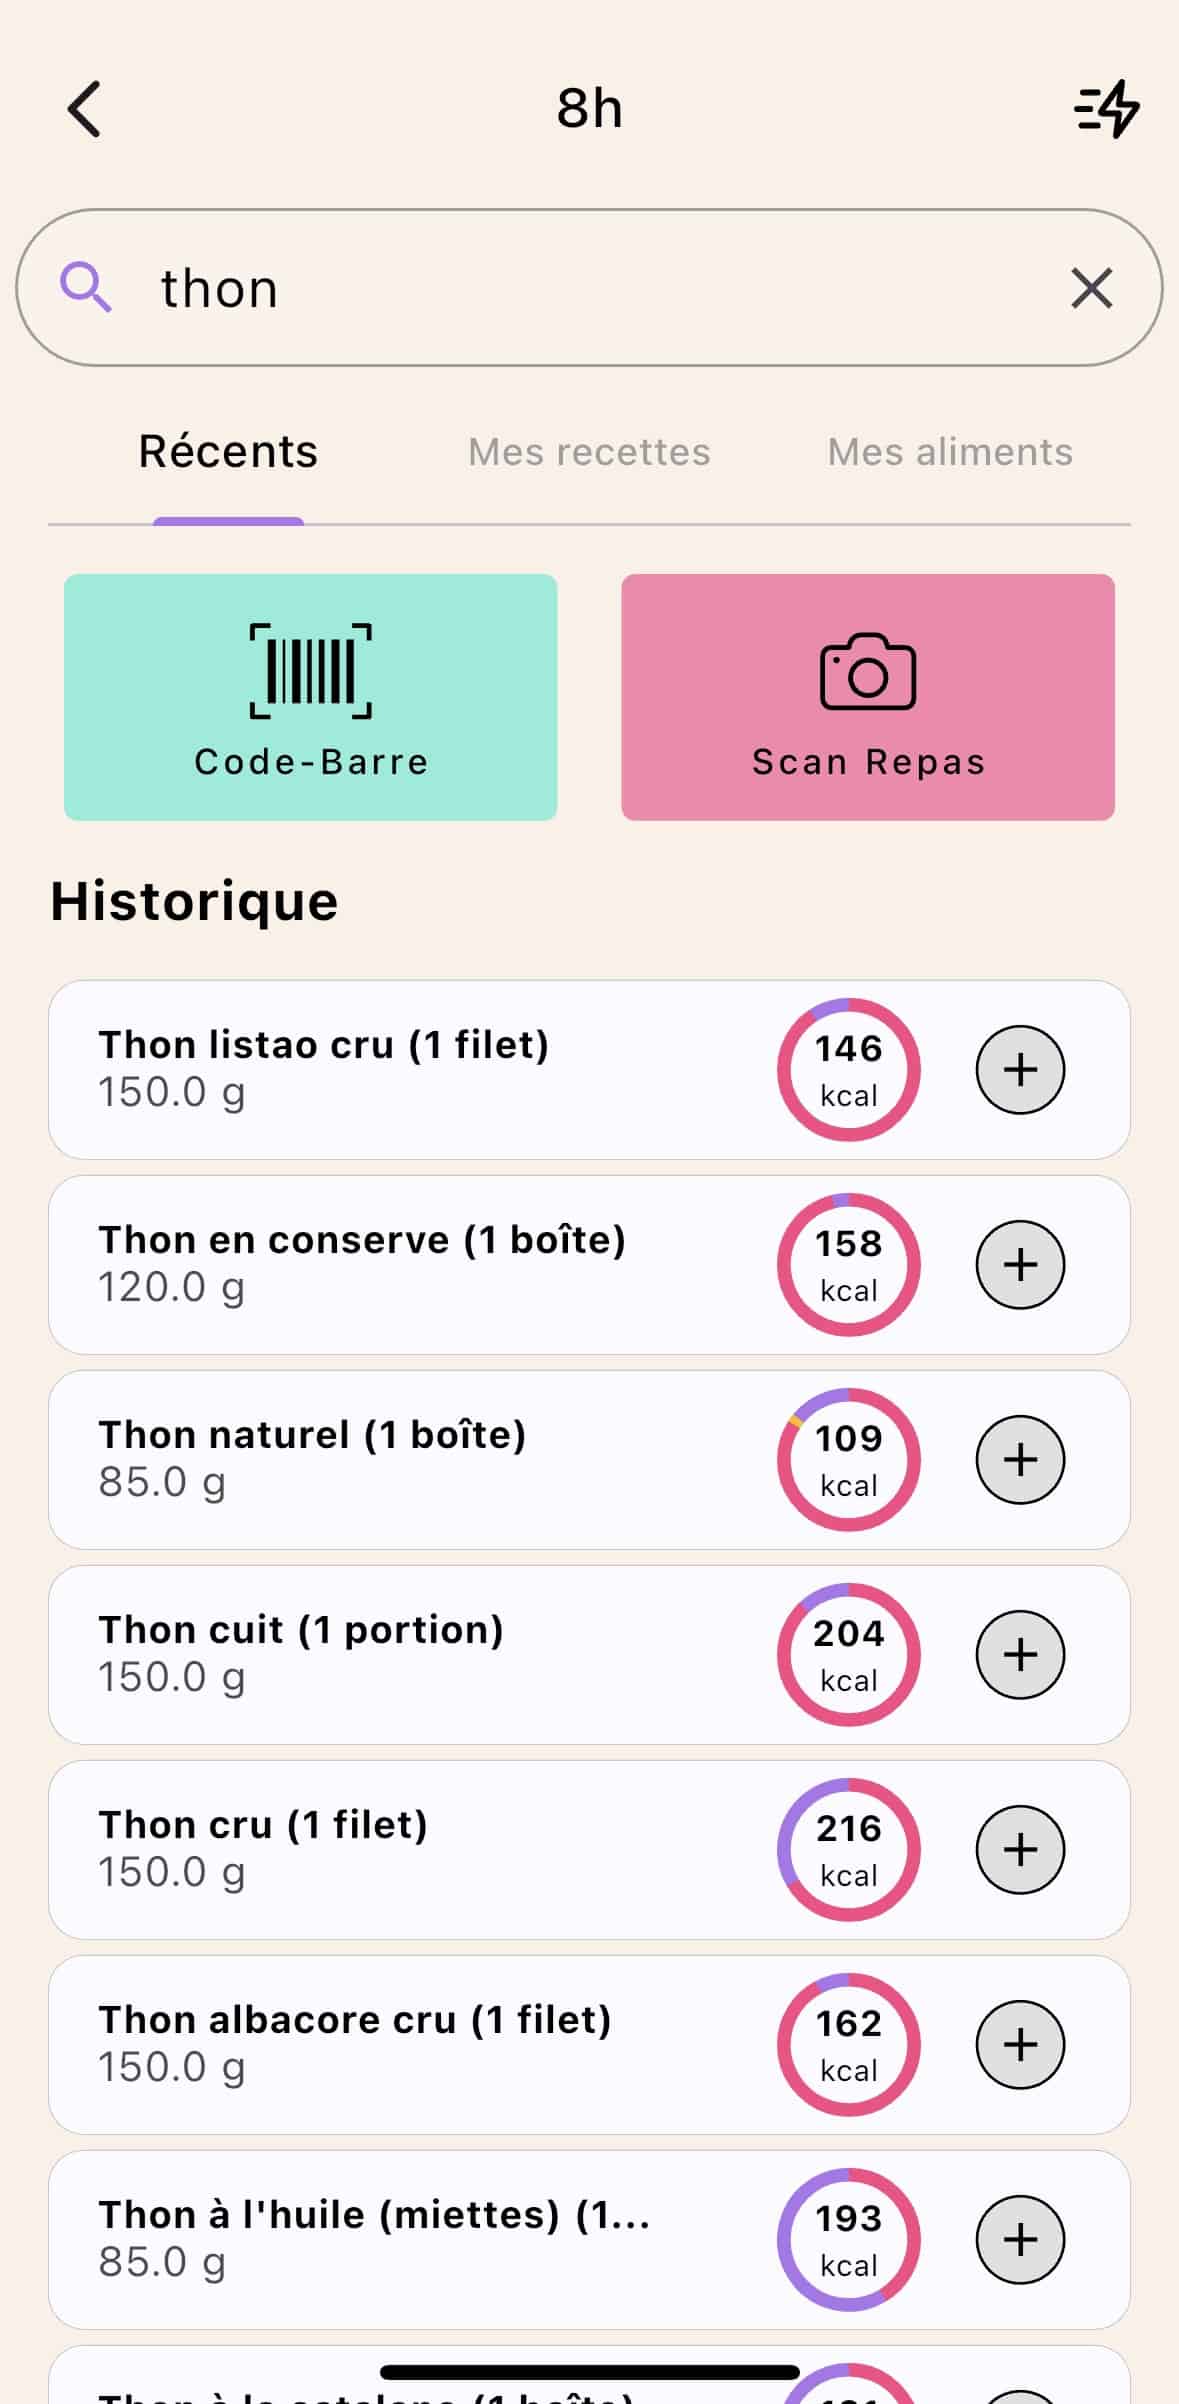
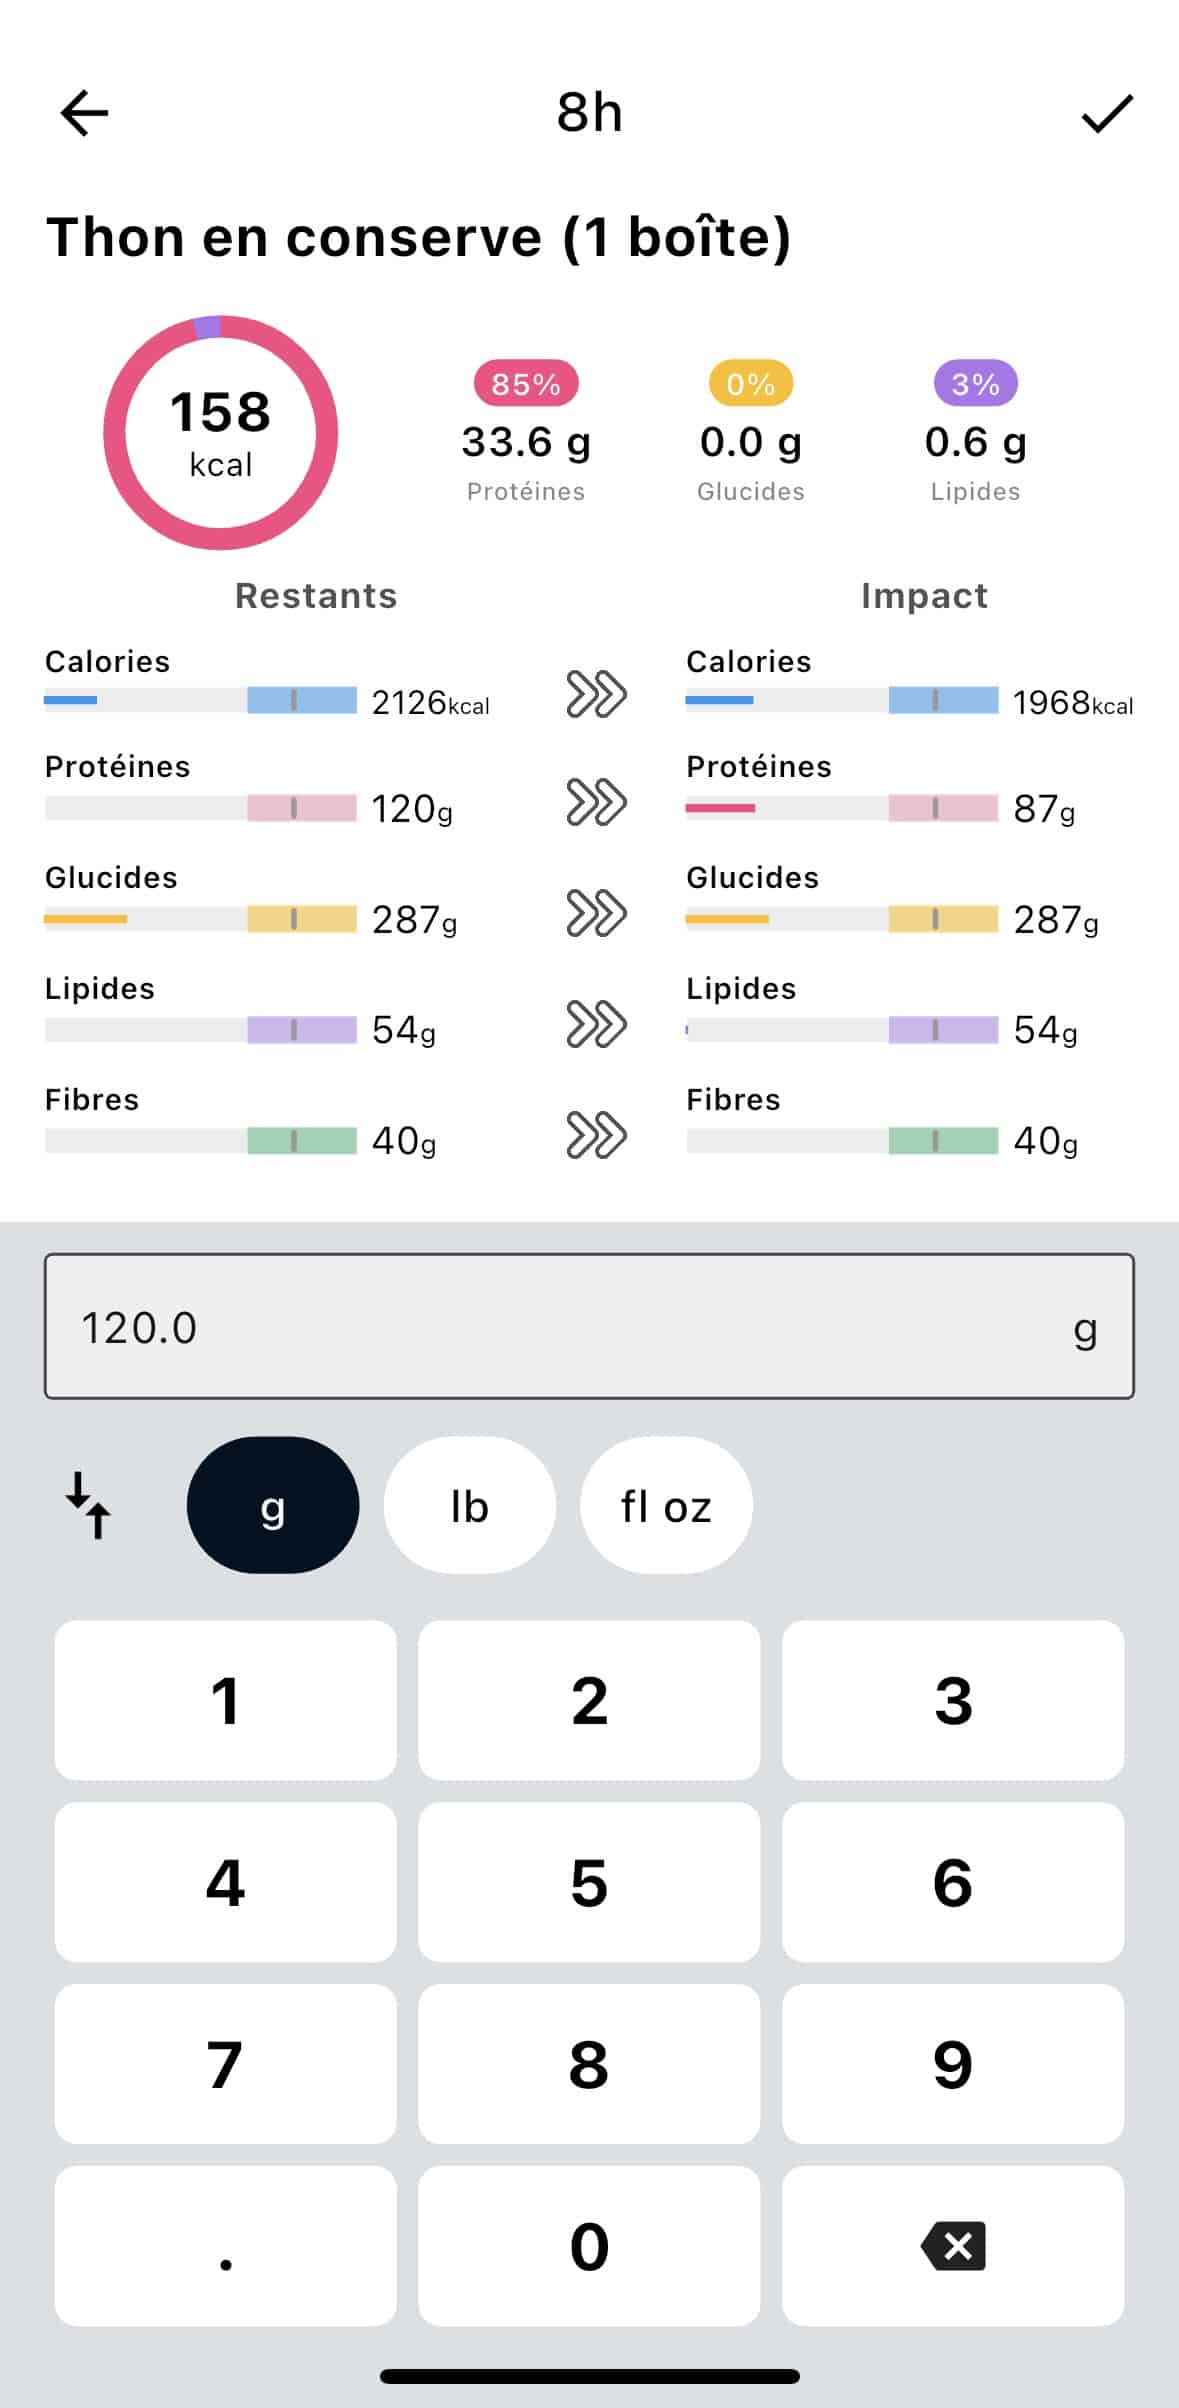
The “Remaining / Impact” panel shows you, before you even confirm, what the food changes on your daily budgets: calories, protein, carbs, fat, fiber. You decide with full knowledge, not after the fact.
Lean cuts the friction to a minimum: history of your frequent foods, search across USDA + OpenFoodFacts, two-tap add from the list. But let’s be honest about the real cost: 2 to 3 minutes per meal, plus the discipline of weighing. That friction is precisely what produces the 80% dropout of the classic method.
The right use: strict cutting, advanced recomposition, weight-class sports. And your 5 to 10 recurring everyday foods, which history makes near-instant.
Quick add: the envelope that saves the day
Birthday buffet, overloaded day, standing meal between two meetings: some meals will never be tracked in detail. Quick add lets you log a global envelope, estimated calories and macros, in 10 seconds. Less precise, infinitely better than a data gap.
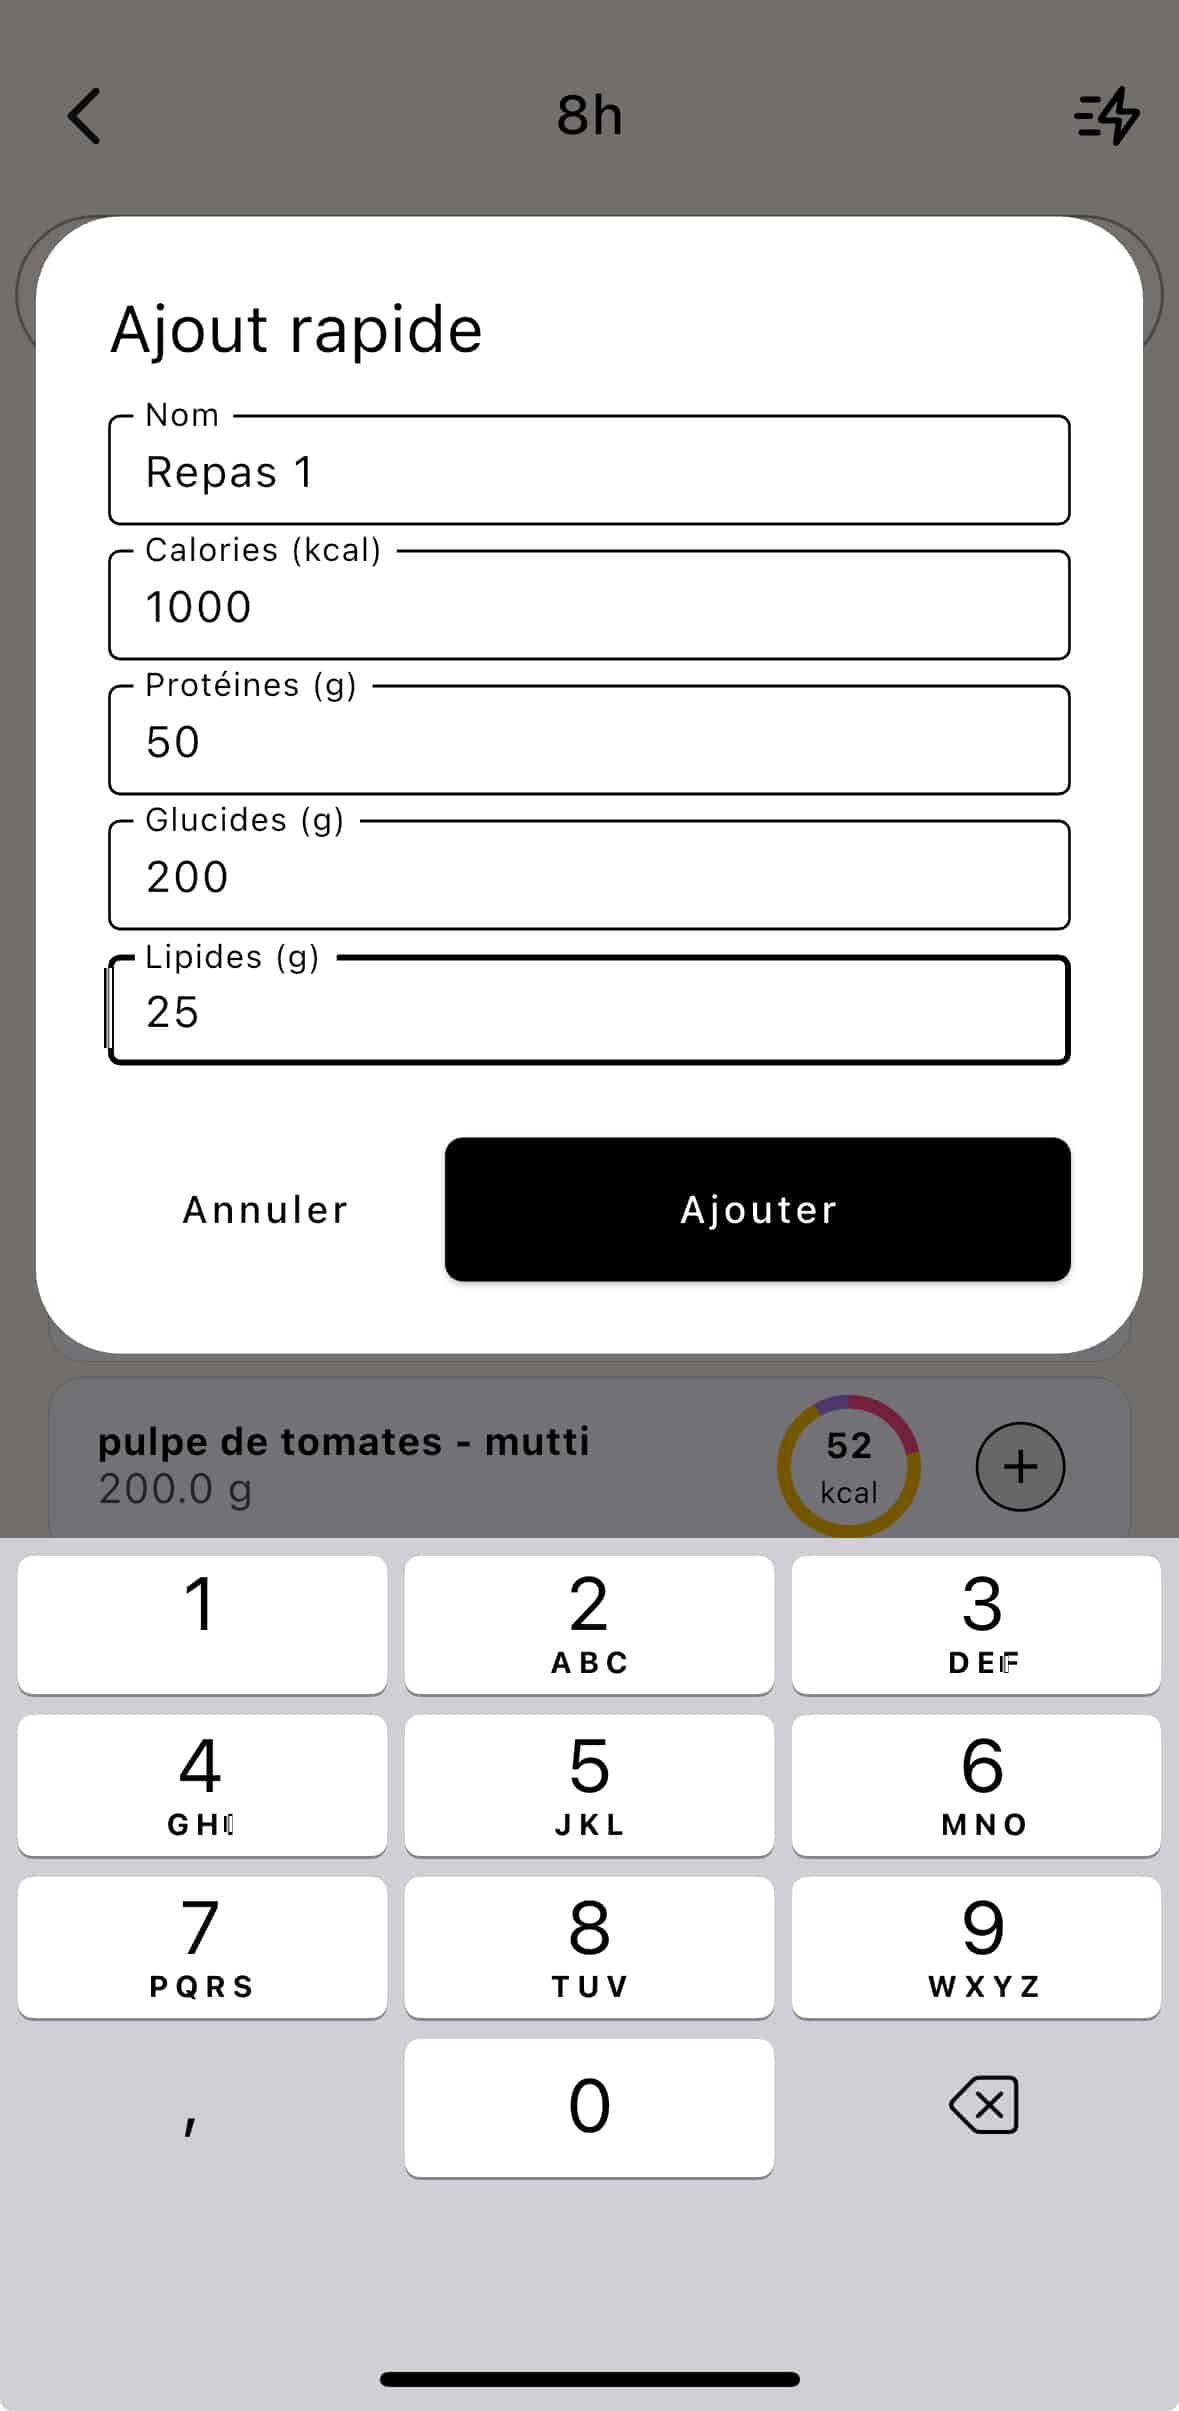
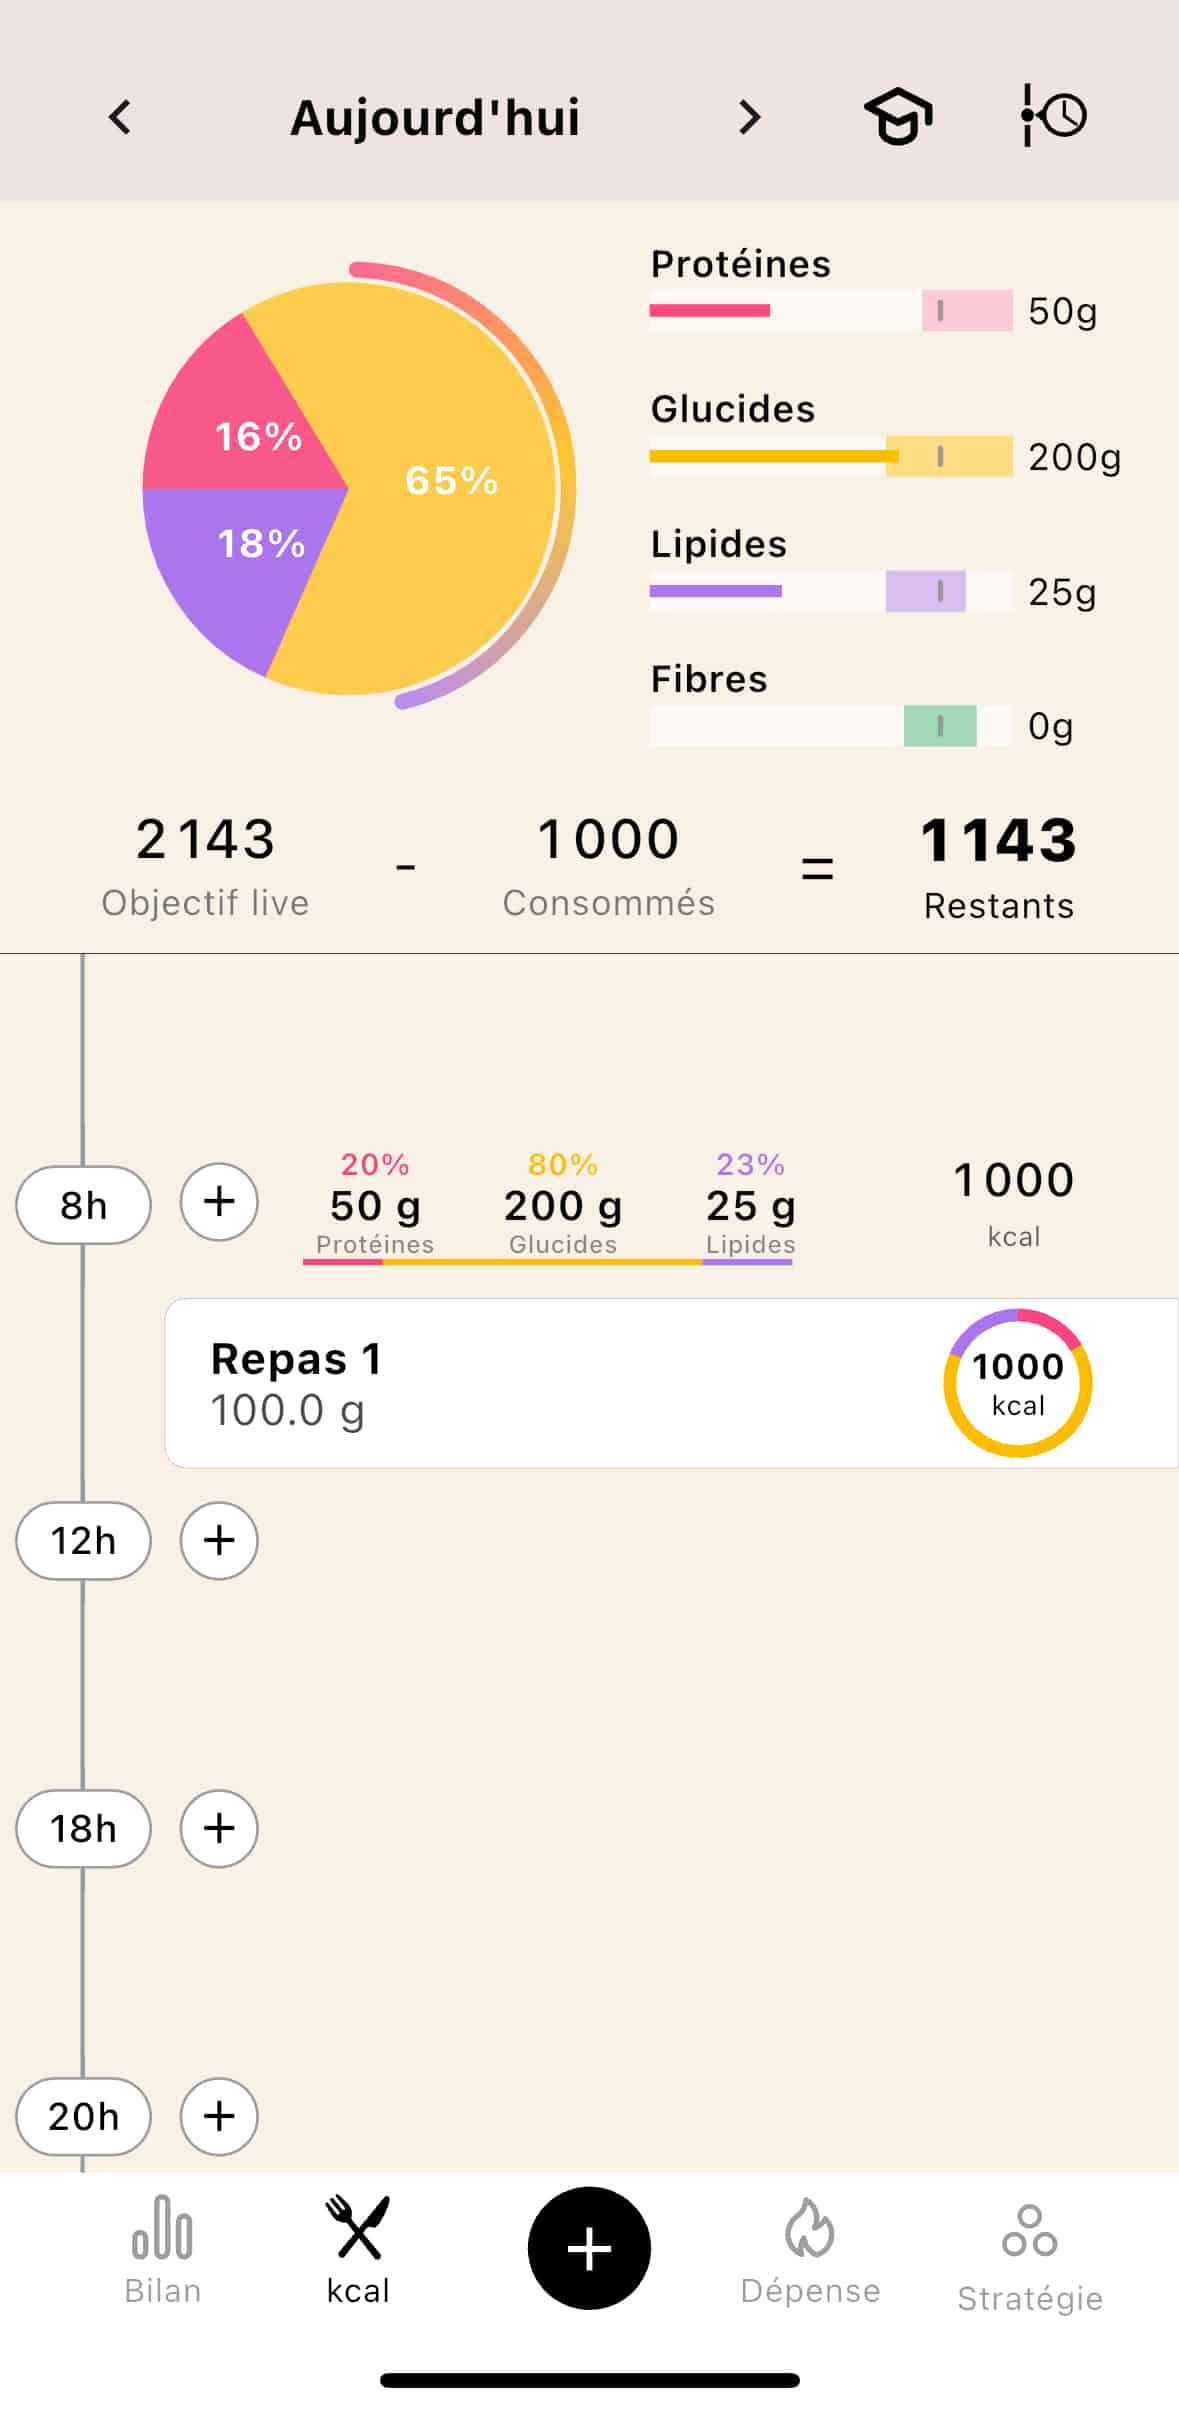
The live calorie balance does the rest: in the capture, a 2,143 kcal target, 1,000 consumed, 1,143 remaining, recalculated continuously throughout the day. An approximate but tracked day beats a perfect abandoned day: the weekly average drives the result, not the purity of one isolated day.
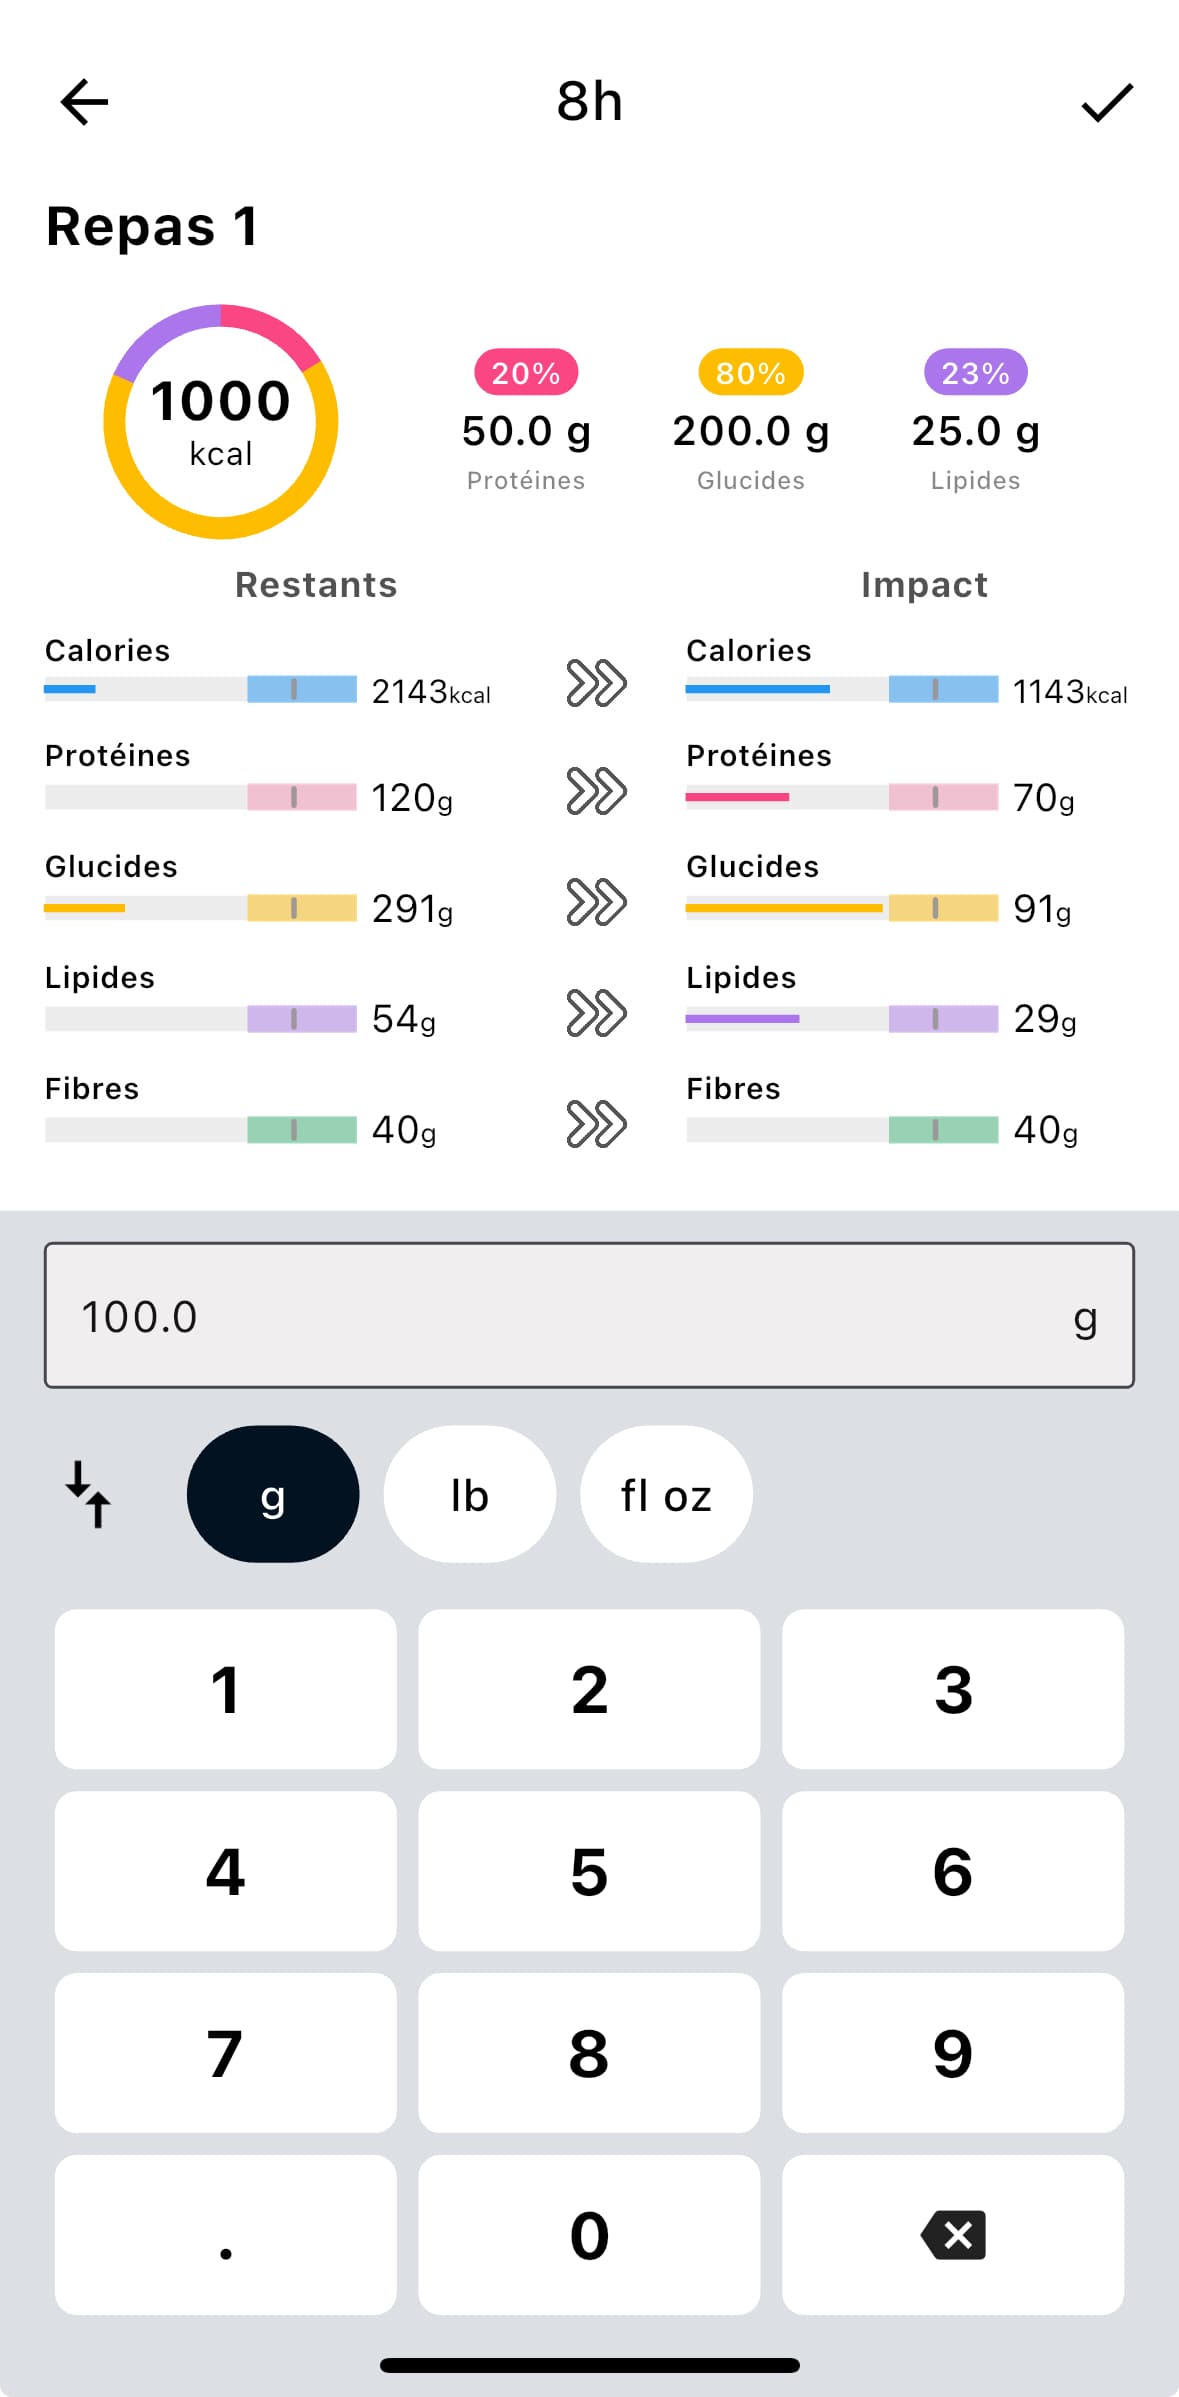
The right use: busy days, social meals, anti-quitting backup. The method that prevents “I missed one meal, the week is ruined”.
Free download
Which method for which profile
First, the match between the 4 methods on the 4 criteria that matter: ease per meal, availability (does it work everywhere, all the time), long-term staying power and accuracy.
AI photo scan
One photo, 5 seconds
Barcode
The exact label
Database + scale
Precision mode
Quick add
The backup envelope
++ excellent + good − weak spot. “Long term” = the probability you will still be using the method in 6 months.
Reading the match: no method wins everywhere. The AI scan dominates on adherence, database + scale on precision, and quick add only exists to plug the gaps. Hence the profiles: the 4 methods are not mutually exclusive, the right strategy is a mix, dosed to your current standards and your schedule. Three profiles cover nearly every case.
Zero friction, learn by doing
AI photo scan everywhere, barcode for packaged food, no weighing. Single goal: last 3 months and train your eye on portions. Precision comes later, habit comes first.
Every percent counts
Scale + database for home meals, barcode for packaged food, AI scan at restaurants. For short phases where precision really pays: end of a cut, official weigh-in.
Reliable data without thinking about it
Barcode and AI scan day to day, quick add as a backup on impossible days. You already know your portions, you just want the data to exist.
Tie-breaking rule, valid for everyone: when in doubt, pick the lightest method you are certain to stick with. Perfect data you stop logging after 3 weeks is worth zero.
The ±10% error that vanishes over a month
The classic objection to the AI scan: “±10% error is too much”. That is reasoning on one isolated meal. But you are not tracking one meal: you track about 90 per month.
Pink: overestimated meals. Green: underestimated meals. Black line: your actual intake. Over a month, the gaps cancel out.
That is the law of large numbers (Kolmogorov): independent random errors cancel out as the number of observations grows. Monday’s +12% cancels Tuesday’s missing 8%. What remains over a month is the model’s average bias, close to zero on a well-calibrated scan, not the noise of one meal.
Manual entry suffers from a problem of an entirely different nature: a systematic bias. Humans under-report what they eat, always in the same direction, and a bias never smooths out.
The takeaway: the question is not “is the AI scan perfect?” but “which method produces the most accurate data over 90 meals?”. And there, automation wins, because it replaces a directional bias with noise that cancels itself out.
Counting is not enough: the other half of the equation is missing
A perfect food diary says nothing on its own. Losing fat is a negative energy balance: intake below expenditure. If your expenditure is miscalculated, your deficit is an accounting fiction, and you can count your calories to the gram without ever moving forward.
The problem: almost every app estimates your expenditure with Harris-Benedict (1919) or Mifflin-St Jeor (1990), raw-weight formulas that ignore your body composition. At equal weight, a body at 15% bodyfat and a body at 30% do not burn anywhere near the same. Lean calculates expenditure differently, in four steps:
AI BodyScan
You take a photo in the app. The AI estimates your bodyfat from your visible morphology, redone every week. That measurement is what anchors the whole calculation on your lean mass, not your raw weight.
BMR via patented proprietary model
Lean’s patented algorithm calculates your basal metabolic rate from your real lean mass. More precise than Harris-Benedict 1919 or Mifflin-St Jeor 1990, which only know your weight.
NEAT, EAT and TEF measured, not flat-rated
Your steps count in NEAT, your workouts in EAT via the reference MET tables, and TEF is calculated from the macros you actually ate, precisely thanks to your tracking.
Metabolic adaptation recalculated
In a prolonged deficit, BMR drops. Lean is the first app to model this coefficient and apply it multiplicatively to BMR. Convention: 100% = optimal, 90% = 10 points of adaptation.
Result: the live calorie balance compares what you eat (counted with the 4 methods in this guide) to what you actually burn, recalculated continuously. It is the combination of both halves, accurate input and accurate output, that makes fat loss predictable. One without the other is bookkeeping in a vacuum.
Free download
Frequently asked questions about calorie counting
How many calories per day to lose weight?
Is the AI photo scan reliable for counting calories?
Do you need to weigh your food to count calories?
Do you need to count calories every day?
Why am I not losing weight even though I count my calories?
Does counting calories make you obsessive?
What is the difference between Lean and MyFitnessPal for counting calories?
References
- Burke L.E., Wang J., Sevick M.A. (2011). Self-monitoring in weight loss: a systematic review of the literature. J Am Diet Assoc. PubMed 21185970.
- Alexander E., Tseng E., Durkin N. et al. (2018). Factors associated with early dropout in an employer-based commercial weight-loss program. Obes Sci Pract. PMC6298204.
- Lichtman S.W. et al. (1992). Discrepancy between self-reported and actual caloric intake and exercise in obese subjects. N Engl J Med. PubMed 1454084.
- Martin C.K. et al. (2009). A novel method to remotely measure food intake of free-living individuals in real time: the remote food photography method. Br J Nutr. PubMed 18616837.
- USDA FoodData Central. The reference nutrition database. fdc.nal.usda.gov.
- Open Food Facts. The global collaborative database of packaged food products. world.openfoodfacts.org.
- Hall K.D. et al. (2011). Quantification of the effect of energy imbalance on bodyweight. Lancet. PubMed 21872751.
- Mifflin M.D. et al. (1990). A new predictive equation for resting energy expenditure in healthy individuals. Am J Clin Nutr. PubMed 2305711.
- Harris J.A., Benedict F.G. (1919). A Biometric Study of Basal Metabolism in Man. Carnegie Institution of Washington.
- Ainsworth B.E. et al. (2011). Compendium of Physical Activities: a second update of codes and MET values. Med Sci Sports Exerc. PubMed 21681120.