Lean vs Cronometer. The micronutrient reference vs the only one that recomputes your TDEE continuously.
Cronometer sees your vitamins. Lean sees your real expenditure. Two depths, two promises.
 The Lean Team · 12 min read · Updated May 21, 2026

 Free download
Cronometer calculates your TDEE with Mifflin-St Jeor 1990 (with no bodyfat measured in the app) and a static activity factor picked at signup from 5 boxes (sedentary, light, moderate, heavy, extreme). Cronometer's real strength is elsewhere: the NCCDB database and 80+ micronutrients tracked with a rigor no one else offers in the consumer space. Lean takes a different stance: recompute every component of the TDEE (BMRBasal Metabolic Rate. Energy expended at rest. In Lean, calculated on actual lean mass via BodyScan AI. on real bodyfat via a patented proprietary model, NEATNon-Exercise Activity Thermogenesis. Expenditure from steps and daily activities outside of sport. from steps, EATExercise Activity Thermogenesis. Expenditure from your sport sessions, calculated via MET. via MET, TEFThermic Effect of Food. Energy spent on digestion. Depends on the macros you eat. per macros) and modulate the BMR through metabolic adaptation continuously, with no coefficient to pick.
Cronometer sees your vitamins, not your metabolic adaptation
You probably already use Cronometer, and for the best of reasons: it is the most rigorous tool on the market for nutritional quality.
You track your vitamins, minerals and amino acids against a clean USDA database rather than a user-fed catalog. On intake, the precision is real.
Take a concrete case. Cronometer announces a TDEE of 2,500 kcal, you eat 2,250, you think you are in a 250 kcal deficit. If your real expenditure is 2,280, only 30 kcal of gap remain: the plateau is mathematical, despite a flawless food log.
Cronometer keeps its promise: laboratory-grade nutritional data. It covers what you eat, not what you burn.
The 1990 BMR formula, with no bodyfat measured in the app
Estimated BMR. Lean's patented proprietary model factors in lean body mass. Mifflin-St Jeor (Cronometer default), does not. A 500 kcal gap, the equivalent of an entire lunch.
Cronometer, despite its rigor on micronutrients, relies by default on Mifflin-St Jeor to estimate your basal metabolic rate.
This 1990 equation rests on 498 subjects and rigorous indirect calorimetry. It is the best compromise available... when all you have is weight, height, age and sex.
To its credit, Cronometer offers the Katch-McArdle equation, which works on lean mass, if you enter your body fat percentage. That is more than the competition. The problem is practical: that value has to be obtained and kept up to date, otherwise the option stays unused.
Without that data, you fall back on the underlying limit: the equation only sees your weight, never your body composition.
Yet fat mass burns very little at rest. Most of it comes from organs and muscles: liver, brain, heart, kidneys. A flawless food database does not compensate for a badly estimated metabolism.
Frankenfield 2013 (PubMed 23631843) compared Mifflin-St Jeor with indirect calorimetry: 87% accuracy in non-obese subjects, 68% in obese subjects, with errors of up to 330 kcal per day.
Tracking 80 micronutrients to the milligram while your expenditure is off by 330 kcal is optimizing the decimal while getting the unit wrong.
The conclusion is the same for all of them: without a body composition measurement, no equation can individualize a metabolism.
The activity factor, picked once and for all
That is the most striking contrast in Cronometer: extreme rigor on the input, an approximation on the output.
Once the basal metabolic rate is set, total expenditure has to be estimated: BMR plus steps, daily activity, workouts and digestion.
Cronometer does what the rest of the market does: an activity level picked from a list, applied as a PAL coefficient.
- Sedentary (PAL 1.2): desk job, little walking
- Light Activity (PAL 1.375): occasional walking
- Moderate Activity (PAL 1.55): sport 3 to 5 times a week
- Heavy (PAL 1.725): intense sport almost daily
- Extreme (PAL 1.9): very intense sport or physical labor
That coefficient multiplies the basal metabolic rate, and the product becomes your calorie target.
The approximation clashes in an app that has you enter micronutrients to the milligram. A sedentary day and a very active day get exactly the same treatment.
Cronometer does import precise data from Garmin, Fitbit or Apple Health. Those signals exist, but the TDEE remains based on the declared coefficient.
Real expenditure measured over 7 days for a Lean user. The grey line is what Cronometer was showing (2,400 kcal flat, PAL Moderate × BMR). The pink annotations show why each day moves.
Yet activity varies a lot from one week to the next. No checkbox stays true for long.
The result is a TDEE that stays off, even though the food log itself is accurate.
This is the decisive point: the quality of the food database does not compensate for a static PAL. NEAT, EAT and TEF need to be computed separately.
A metabolism without up-to-date body composition, plus an activity expenditure estimated by coefficient: the precision of the log is not enough to save the final target.
Metabolic adaptation, never modeled
It is the one piece of data no nutritional database, however complete, can provide.
In a prolonged deficit, your body reduces its expenditure to compensate for the lack of intake. Comparable to a phone's low-power mode: everything still works, but at reduced output.
This metabolic adaptation is solidly documented: Müller 2015 (PubMed 26399868, reanalysis of the Minnesota experiment), Doucet 2001 on prolonged deficit, Nunes 2020 (PMC7484122). Studies place the effect between 5 and 25% of basal metabolic rate.
- Deficit of −250 kcal per day, over 2 to 8 weeks: adaptation of 5 to 10% (TDEE drops to 90-95 % of the initial level)
- Deficit of −500 kcal per day: 10 to 15% adaptation (TDEE drops to 85-90 %)
- Deficit of −750 kcal per day: 15 to 25% adaptation (TDEE drops to 75-85 %)
Lean convention: 100% for an optimal metabolism, 90% for a 10% adaptation. Since NEAT, EAT and TEF are all derived from BMR, the whole TDEE drifts.
real TDEE over 8 weeks of deficit at −500 kcal/day. The pink curve drops. The Cronometer line stays flat. By week 6, you're already at maintenance. Without having changed anything.
In numbers: a targeted 25% deficit on 2,000 kcal gives a goal of 1,500 kcal. With 14% adaptation, the real TDEE drops to 1,720 kcal and the real deficit is only 220 kcal.
The phenomenon is gradual, so hard to spot. You lose weight, you validate your method, then the gap settles in week after week until progress stops completely.
You can then log every food to the gram and track 80 micronutrients: none of that data will tell you that your expenditure has dropped by 12%. The precision covers what you eat, not what you burn.
Cronometer does not model metabolic adaptation. Your target stays the same as long as you do not change your settings by hand, however detailed your food log.
How Lean fixes each of the 3 problems
Cronometer and Lean pursue two different goals. Cronometer aims at nutritional precision: a clean USDA database, 80+ tracked micronutrients, laboratory rigor on what you eat. Lean aims at energy precision: how much your body really burns, day after day. Both are legitimate, but a flawless micronutrient log sitting on an approximate TDEE will not melt one more gram. Here is how Lean handles each component.
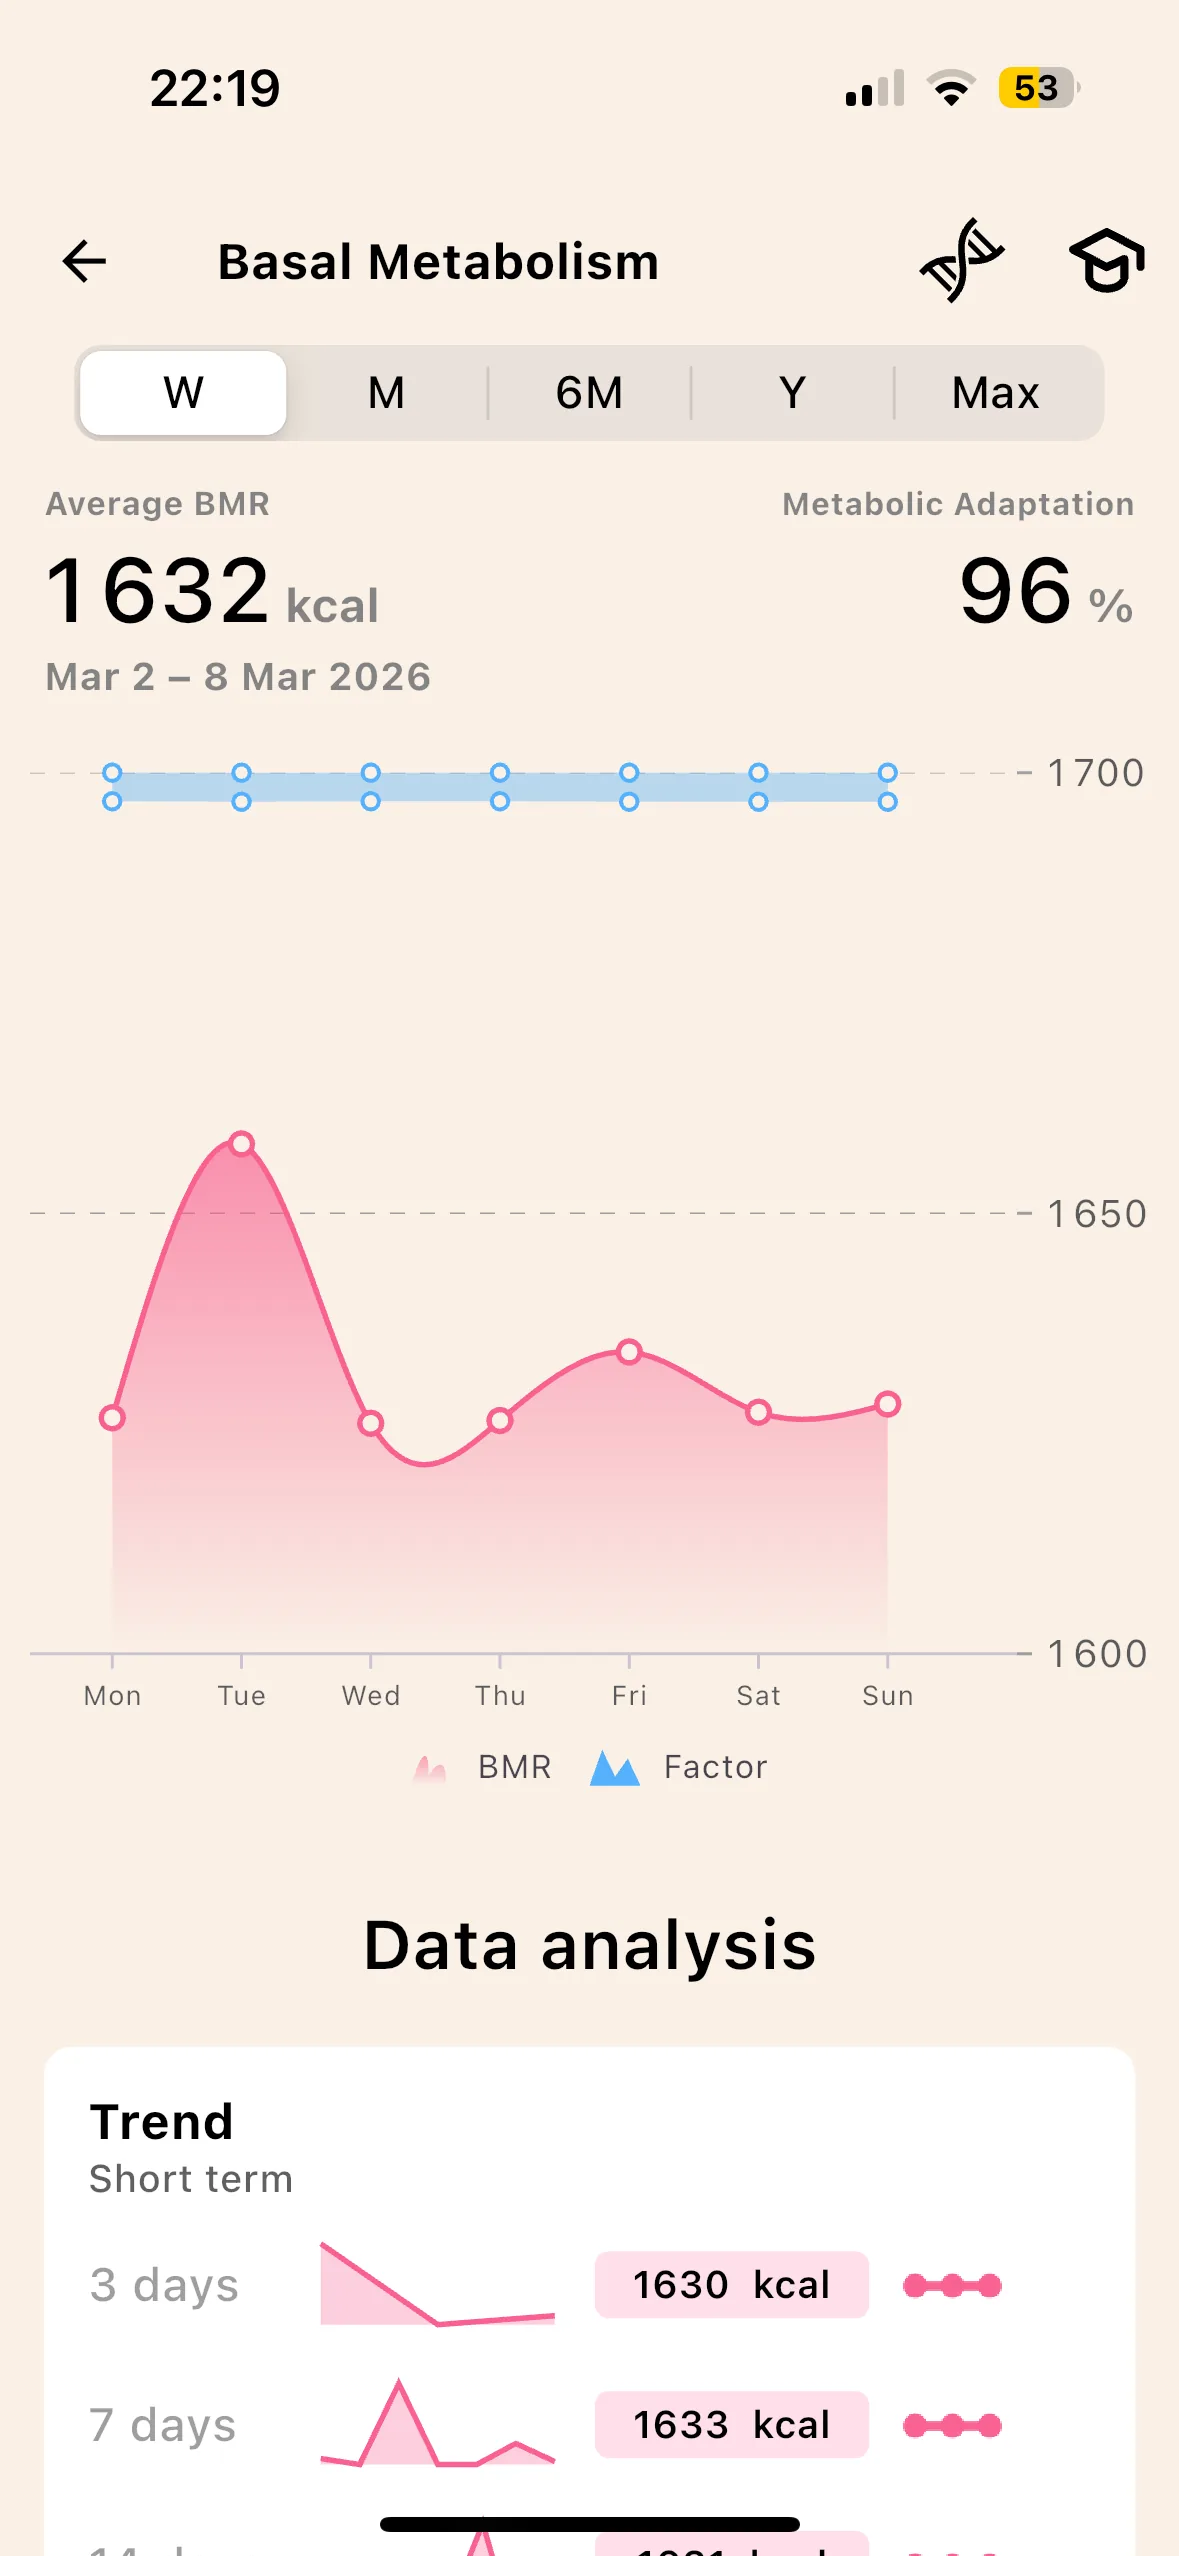
Proprietary patented model, built on lean mass
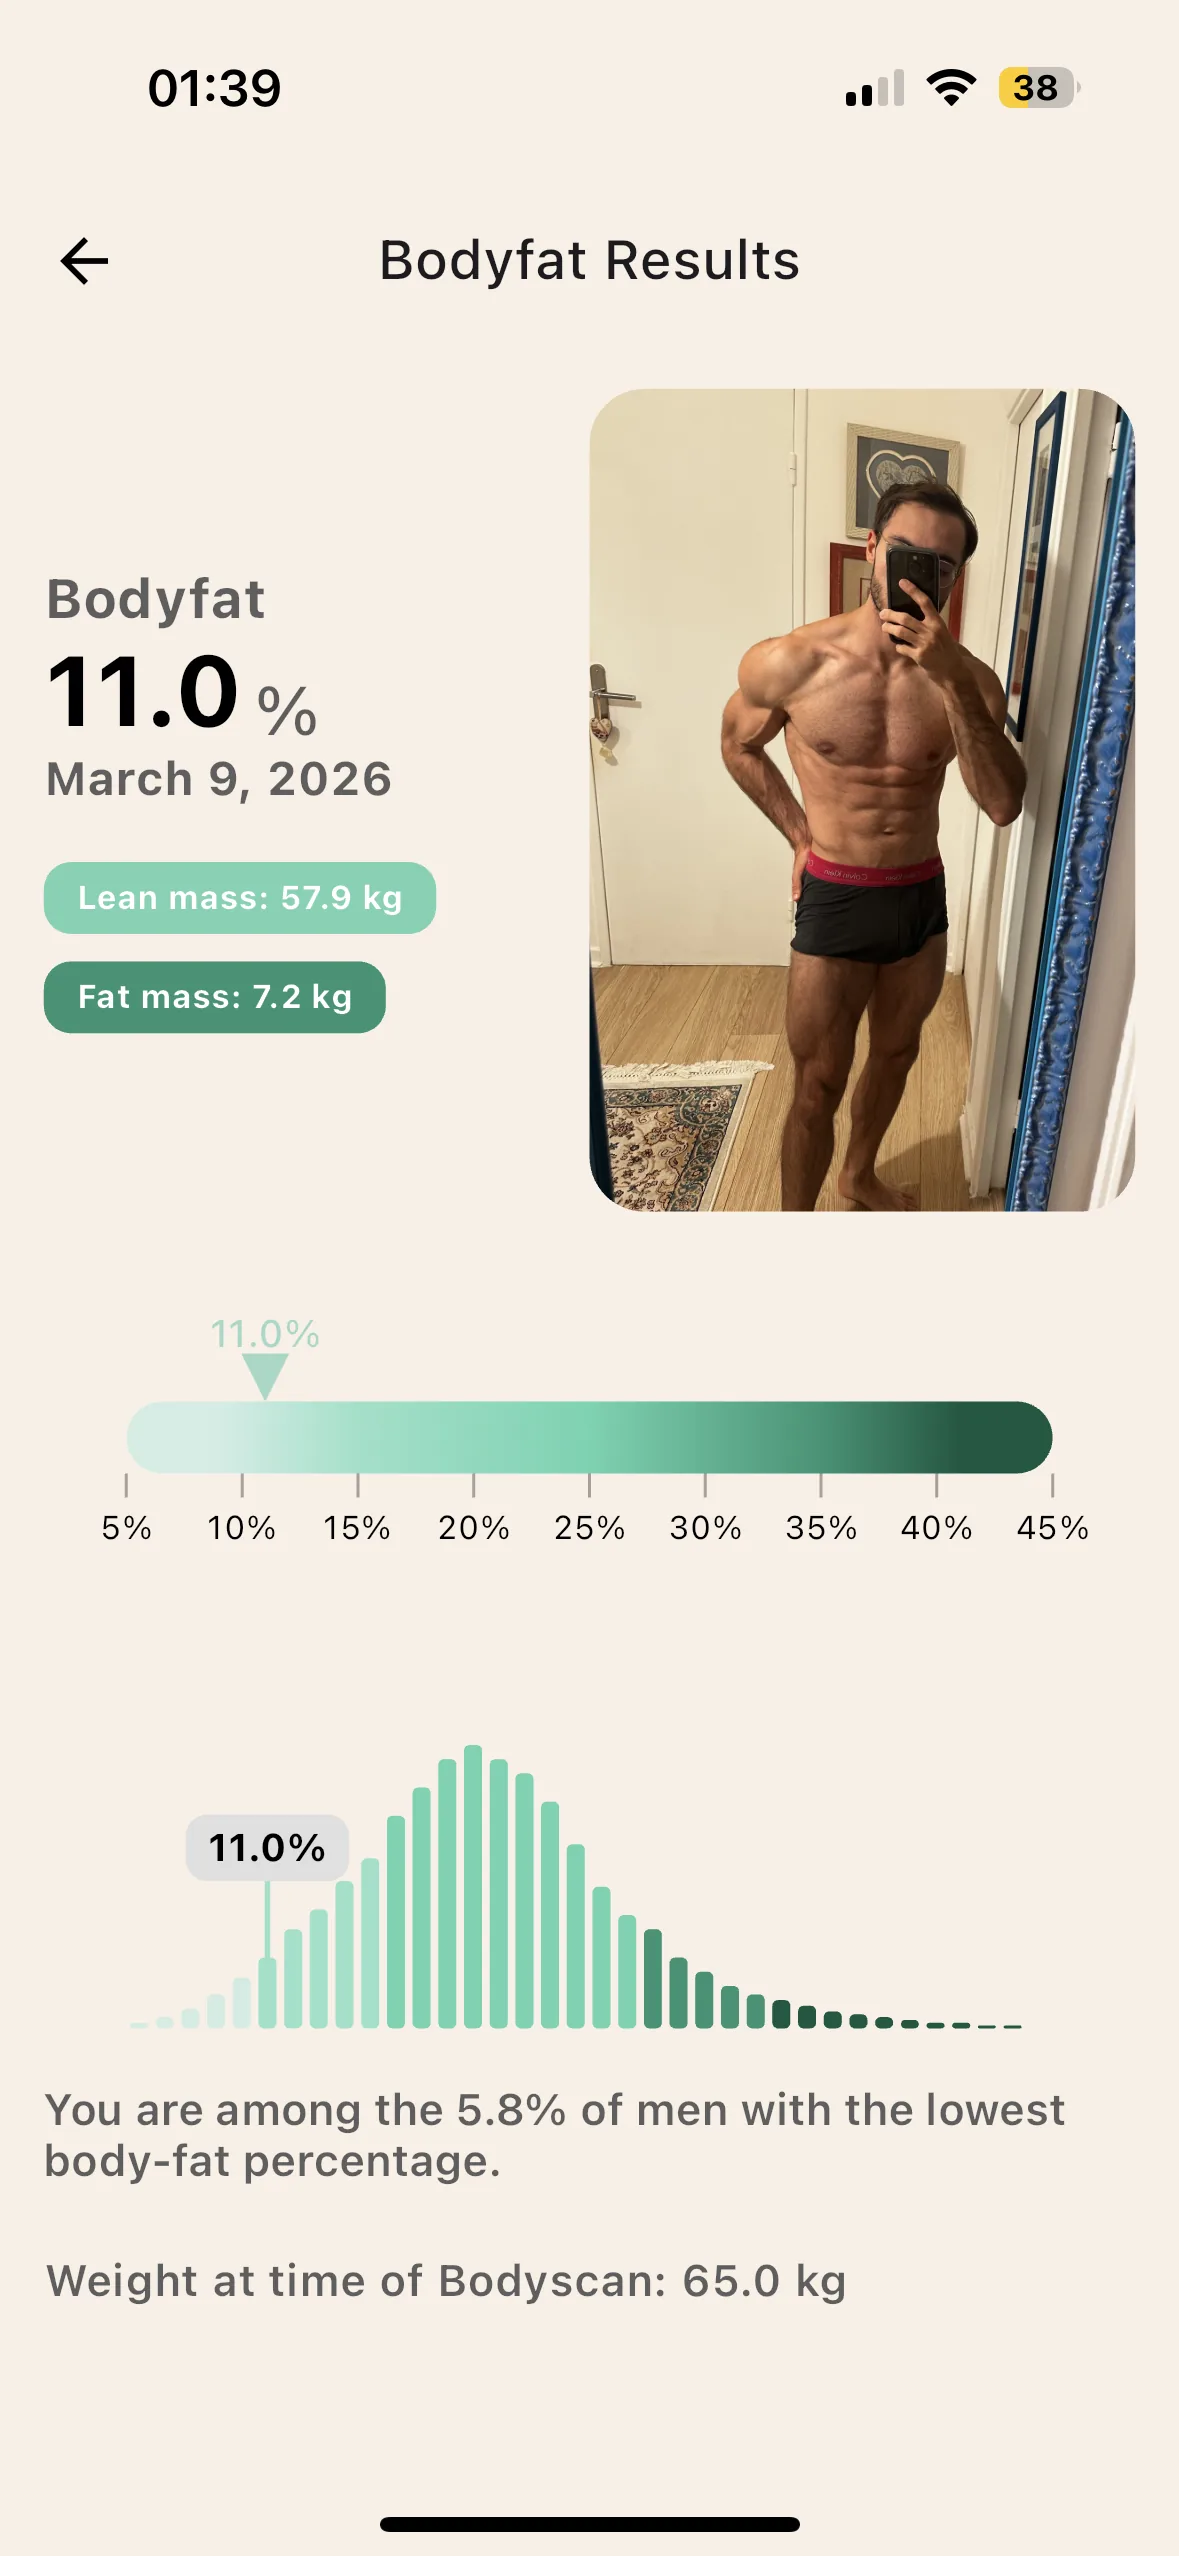
Cronometer offers the Katch-McArdle equation if you type in your body fat by hand, which is already better than the market average. The problem lies elsewhere: who knows their up-to-date body fat percentage, every week, without a DEXA scan? Lean starts from lean mass measured, not declared.
That is the role of the AI BodyScan : one photo, a model trained on a bank of DEXA scans, your body fat in a few seconds. Repeated every week, it automatically feeds the metabolism calculation. The data Cronometer expects from you, Lean produces.
No skinfold calipers, no impedance scale sensitive to hydration, no DEXA appointment. One weekly photo.
NEAT, EAT, TEF calculated separately
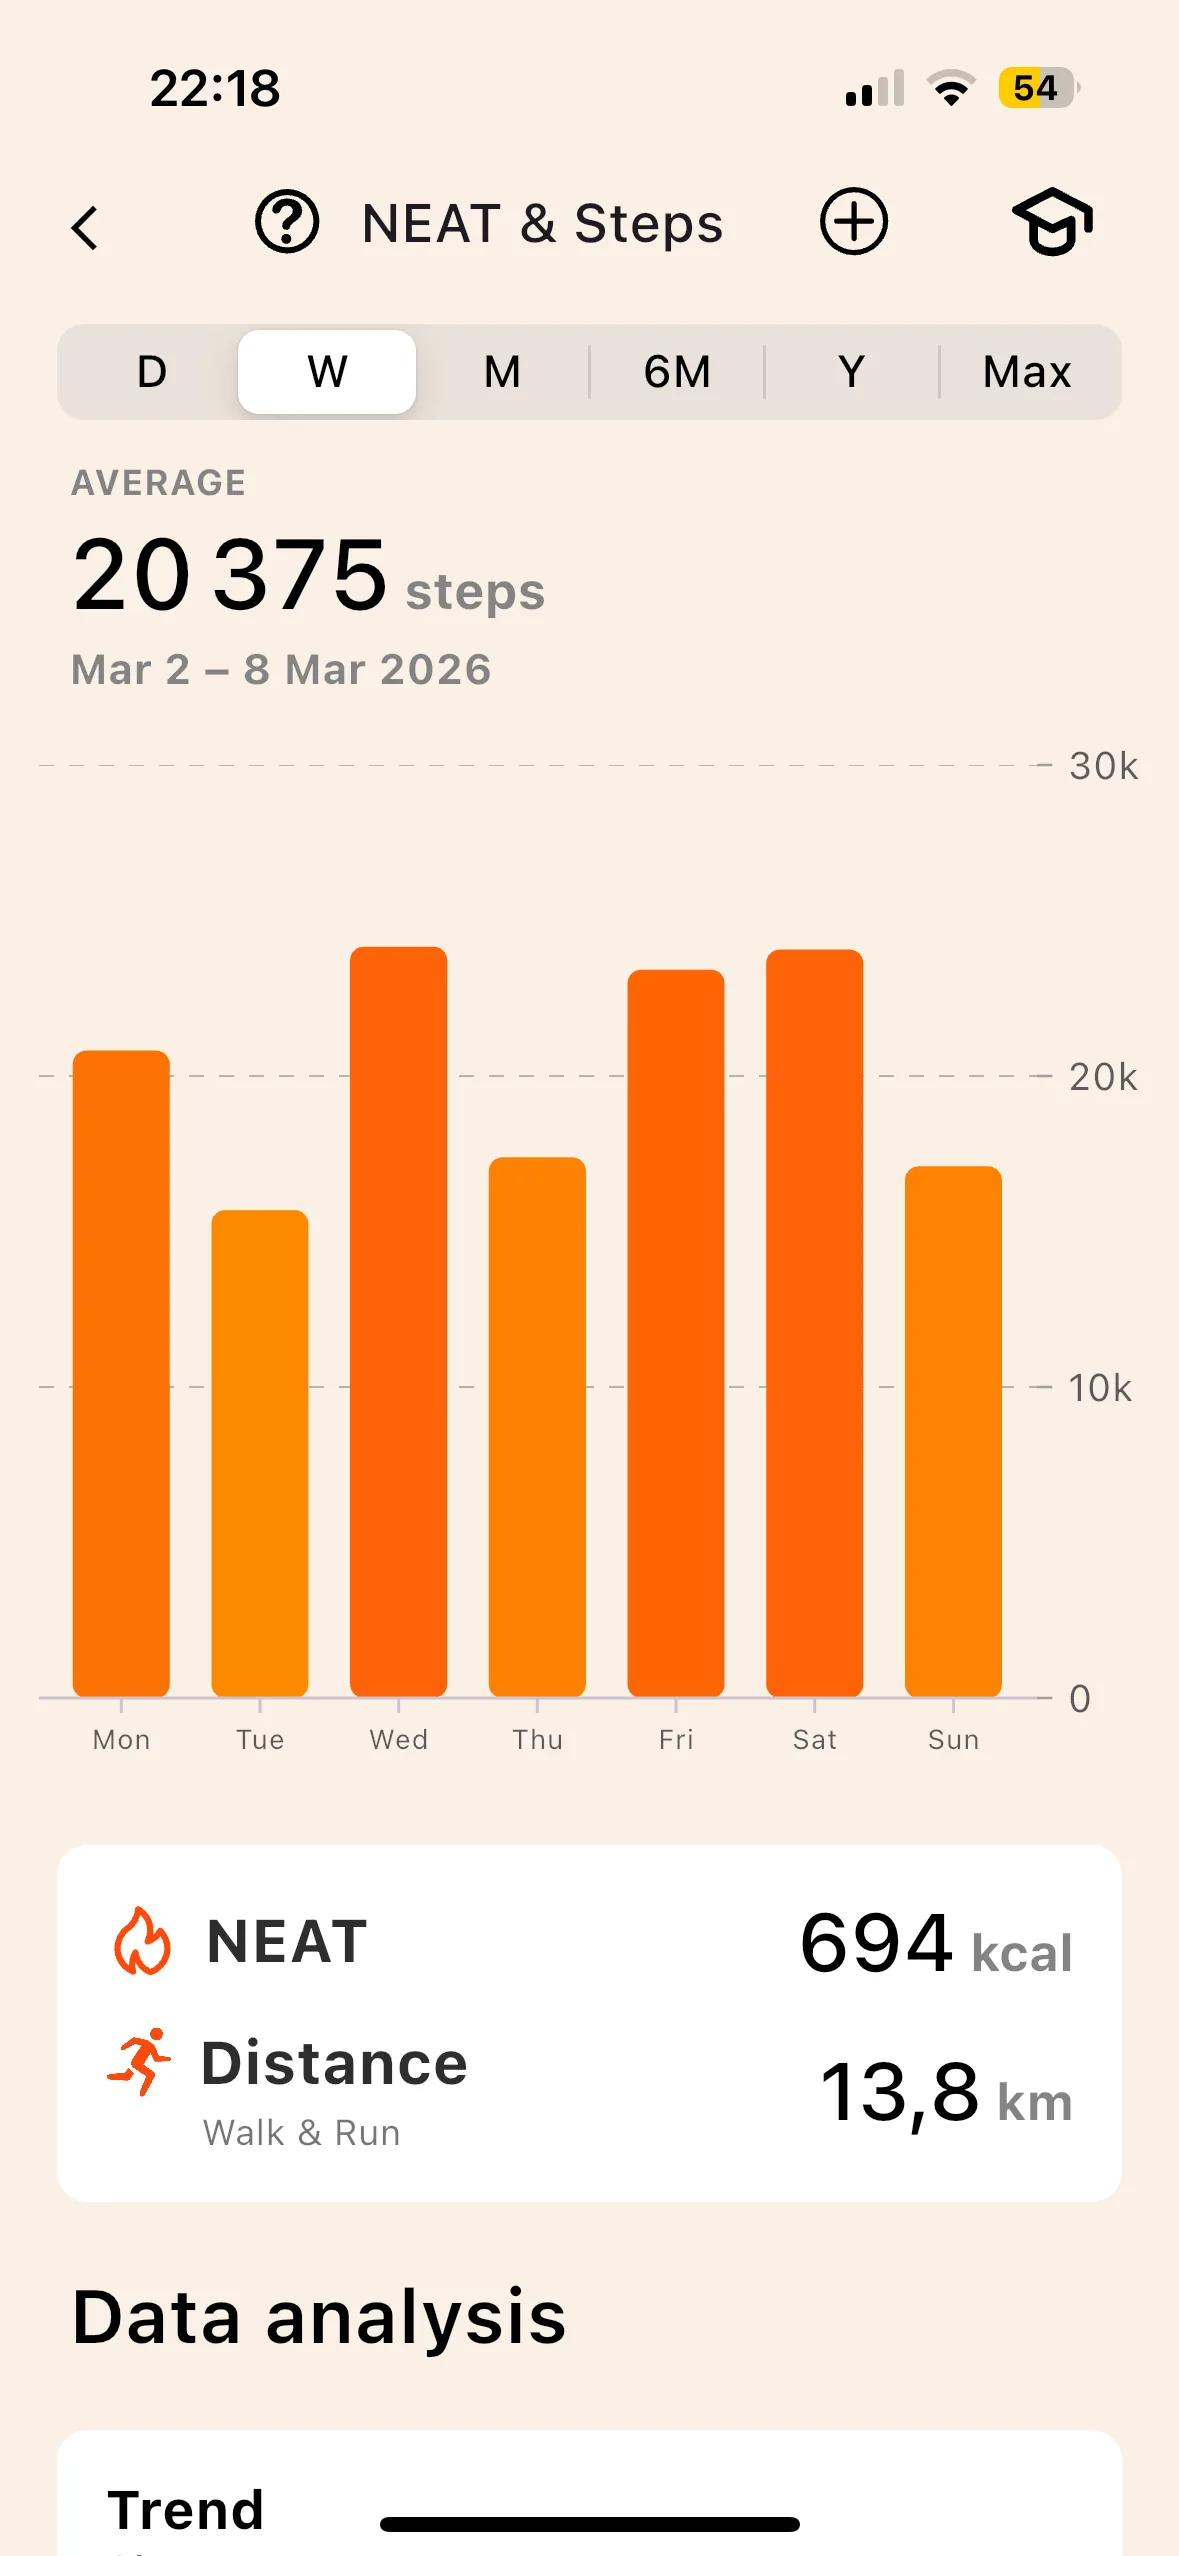
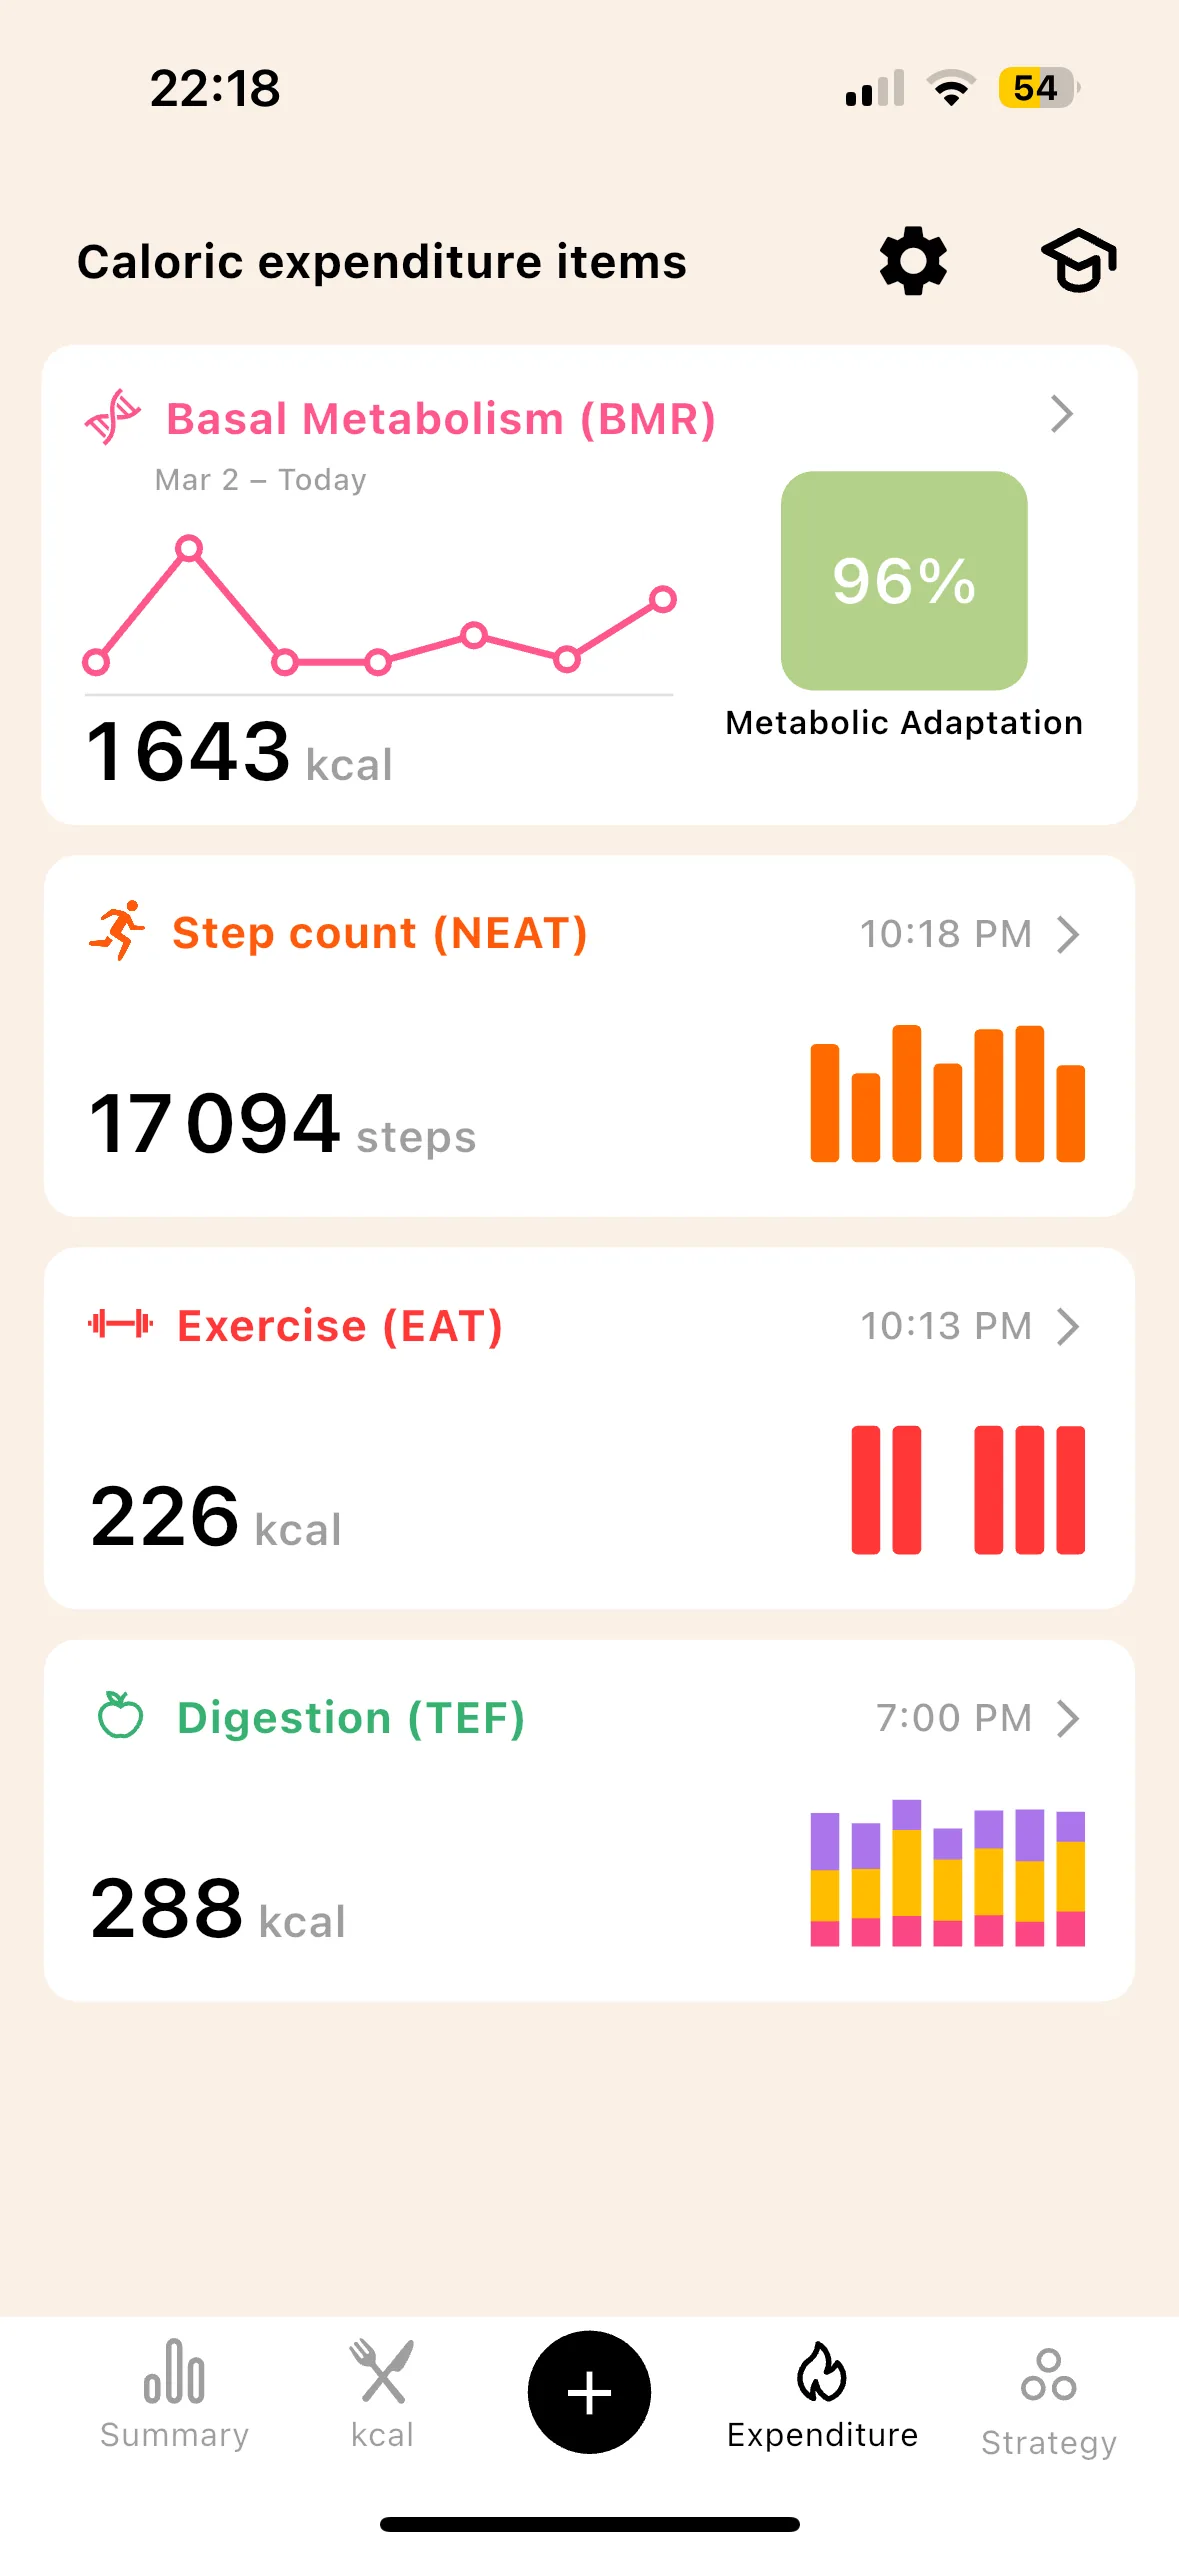
NEAT. Your real steps come in through HealthKit (iOS) or Google Fit (Android), then are converted into calories according to your metabolism. Cronometer can import activity data, but its TDEE is still built on an activity factor you choose: the most variable item of your expenditure remains a declaration.
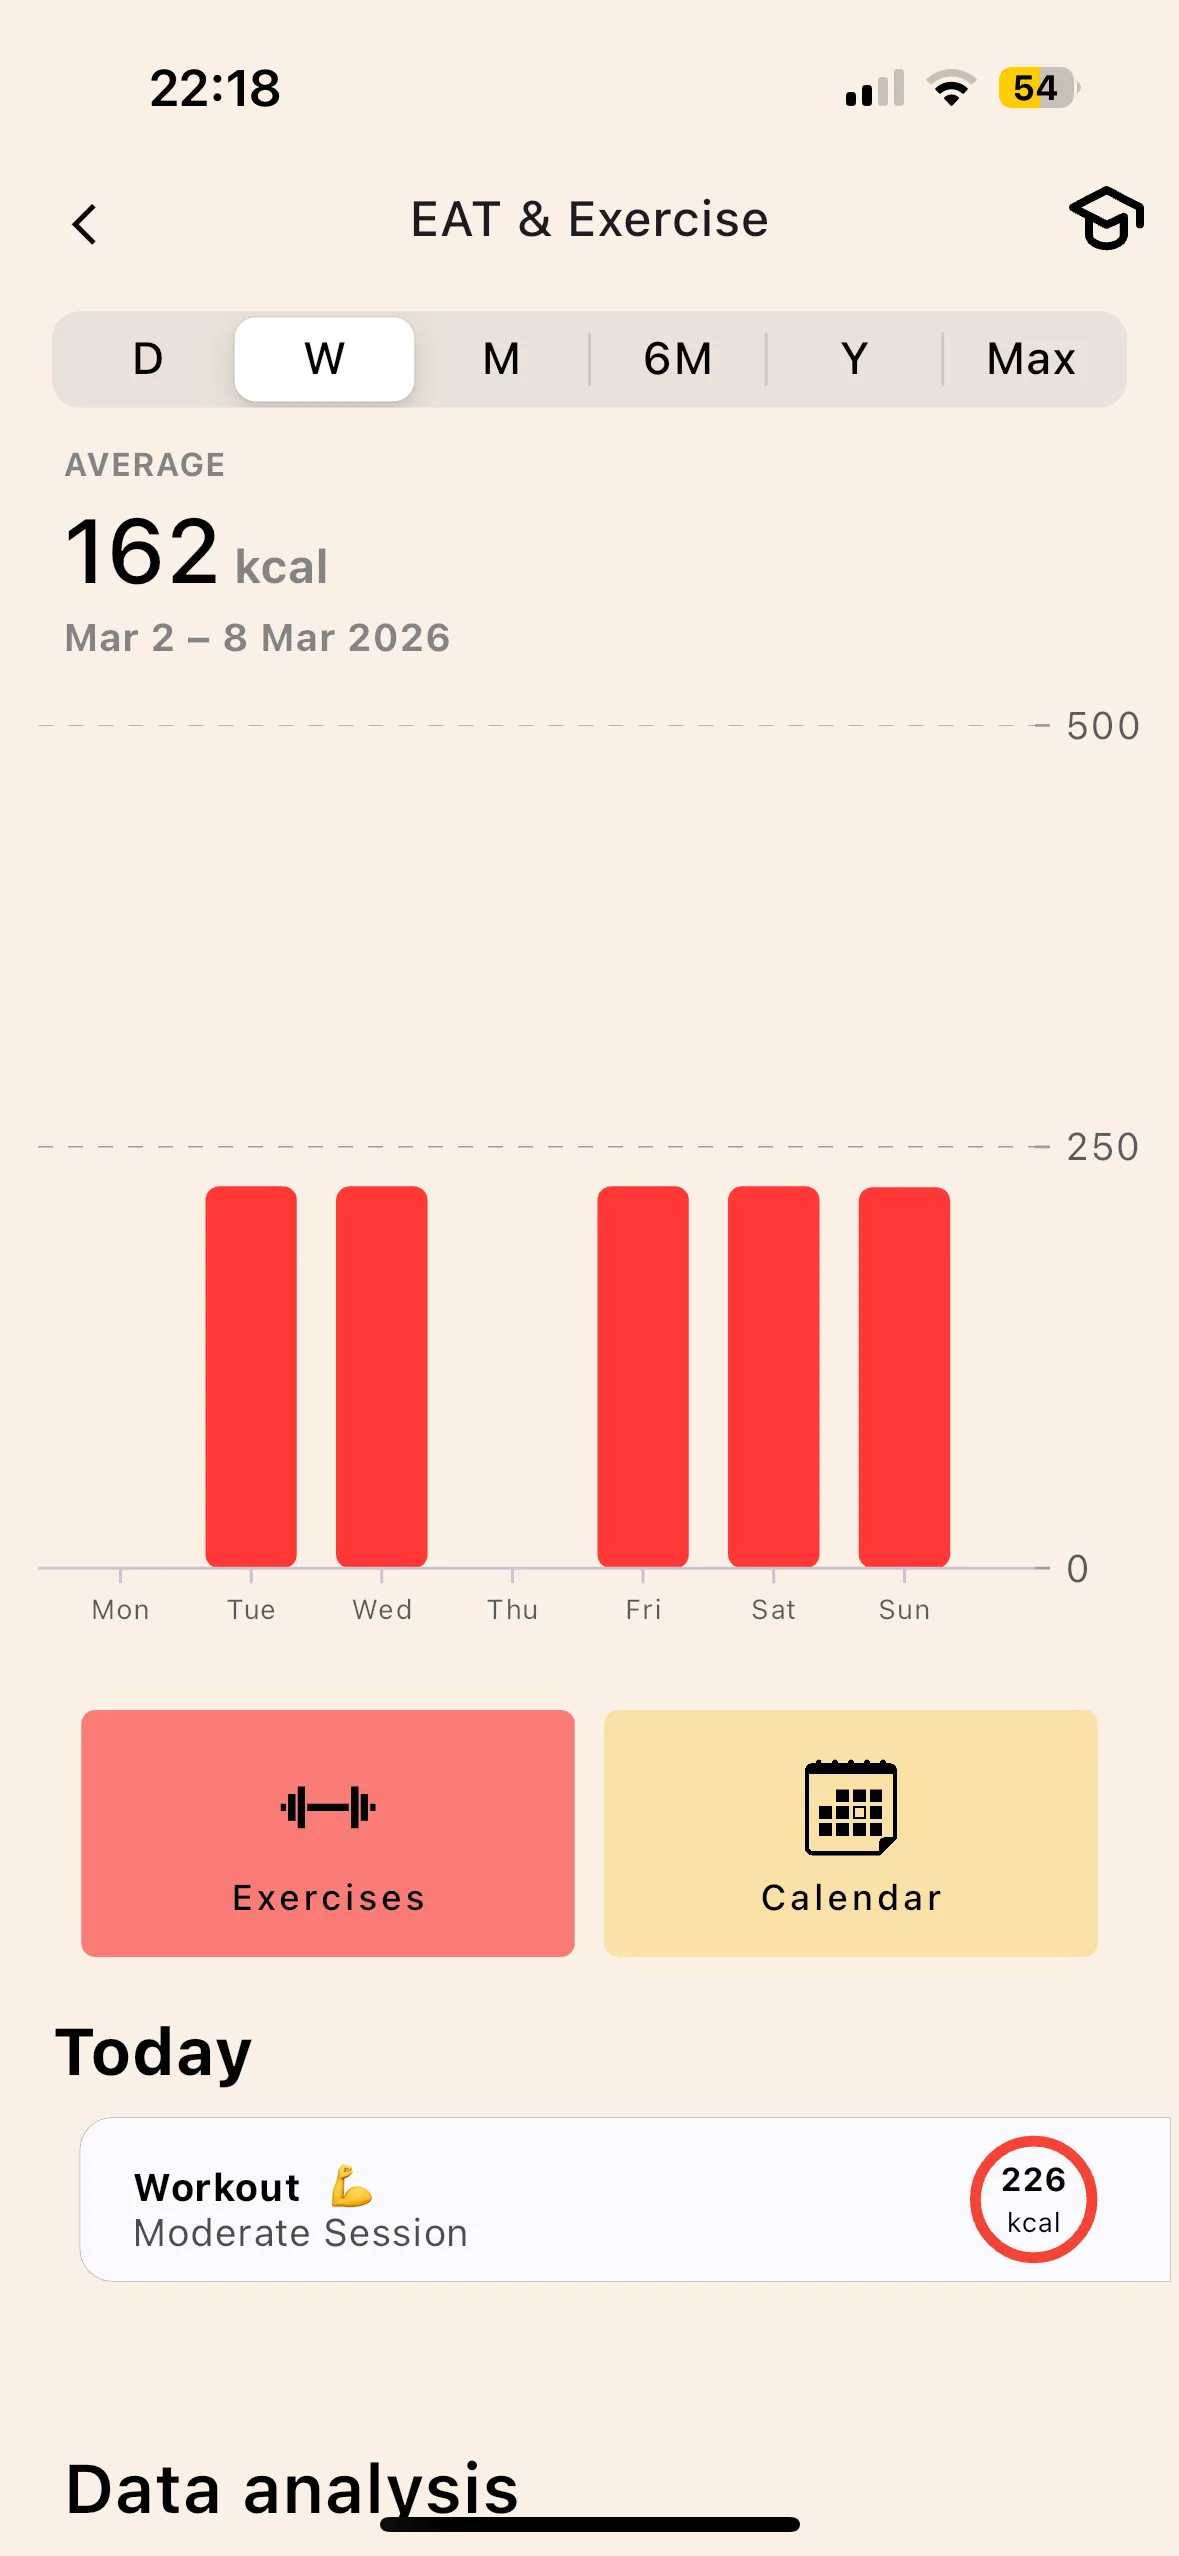
EAT. Each session is computed by MET on your actual effort time. An hour of lifting interrupted by rest is not worth an hour of running: the gap adds up to hundreds of kcal over a training week.
TEF. Cronometer knows your macros to the gram, that is its strength. Lean uses them to compute the real cost of your digestion: 20 to 30% for protein, 5 to 10% for carbohydrates, 1 to 3% for fat, instead of a flat 10%.
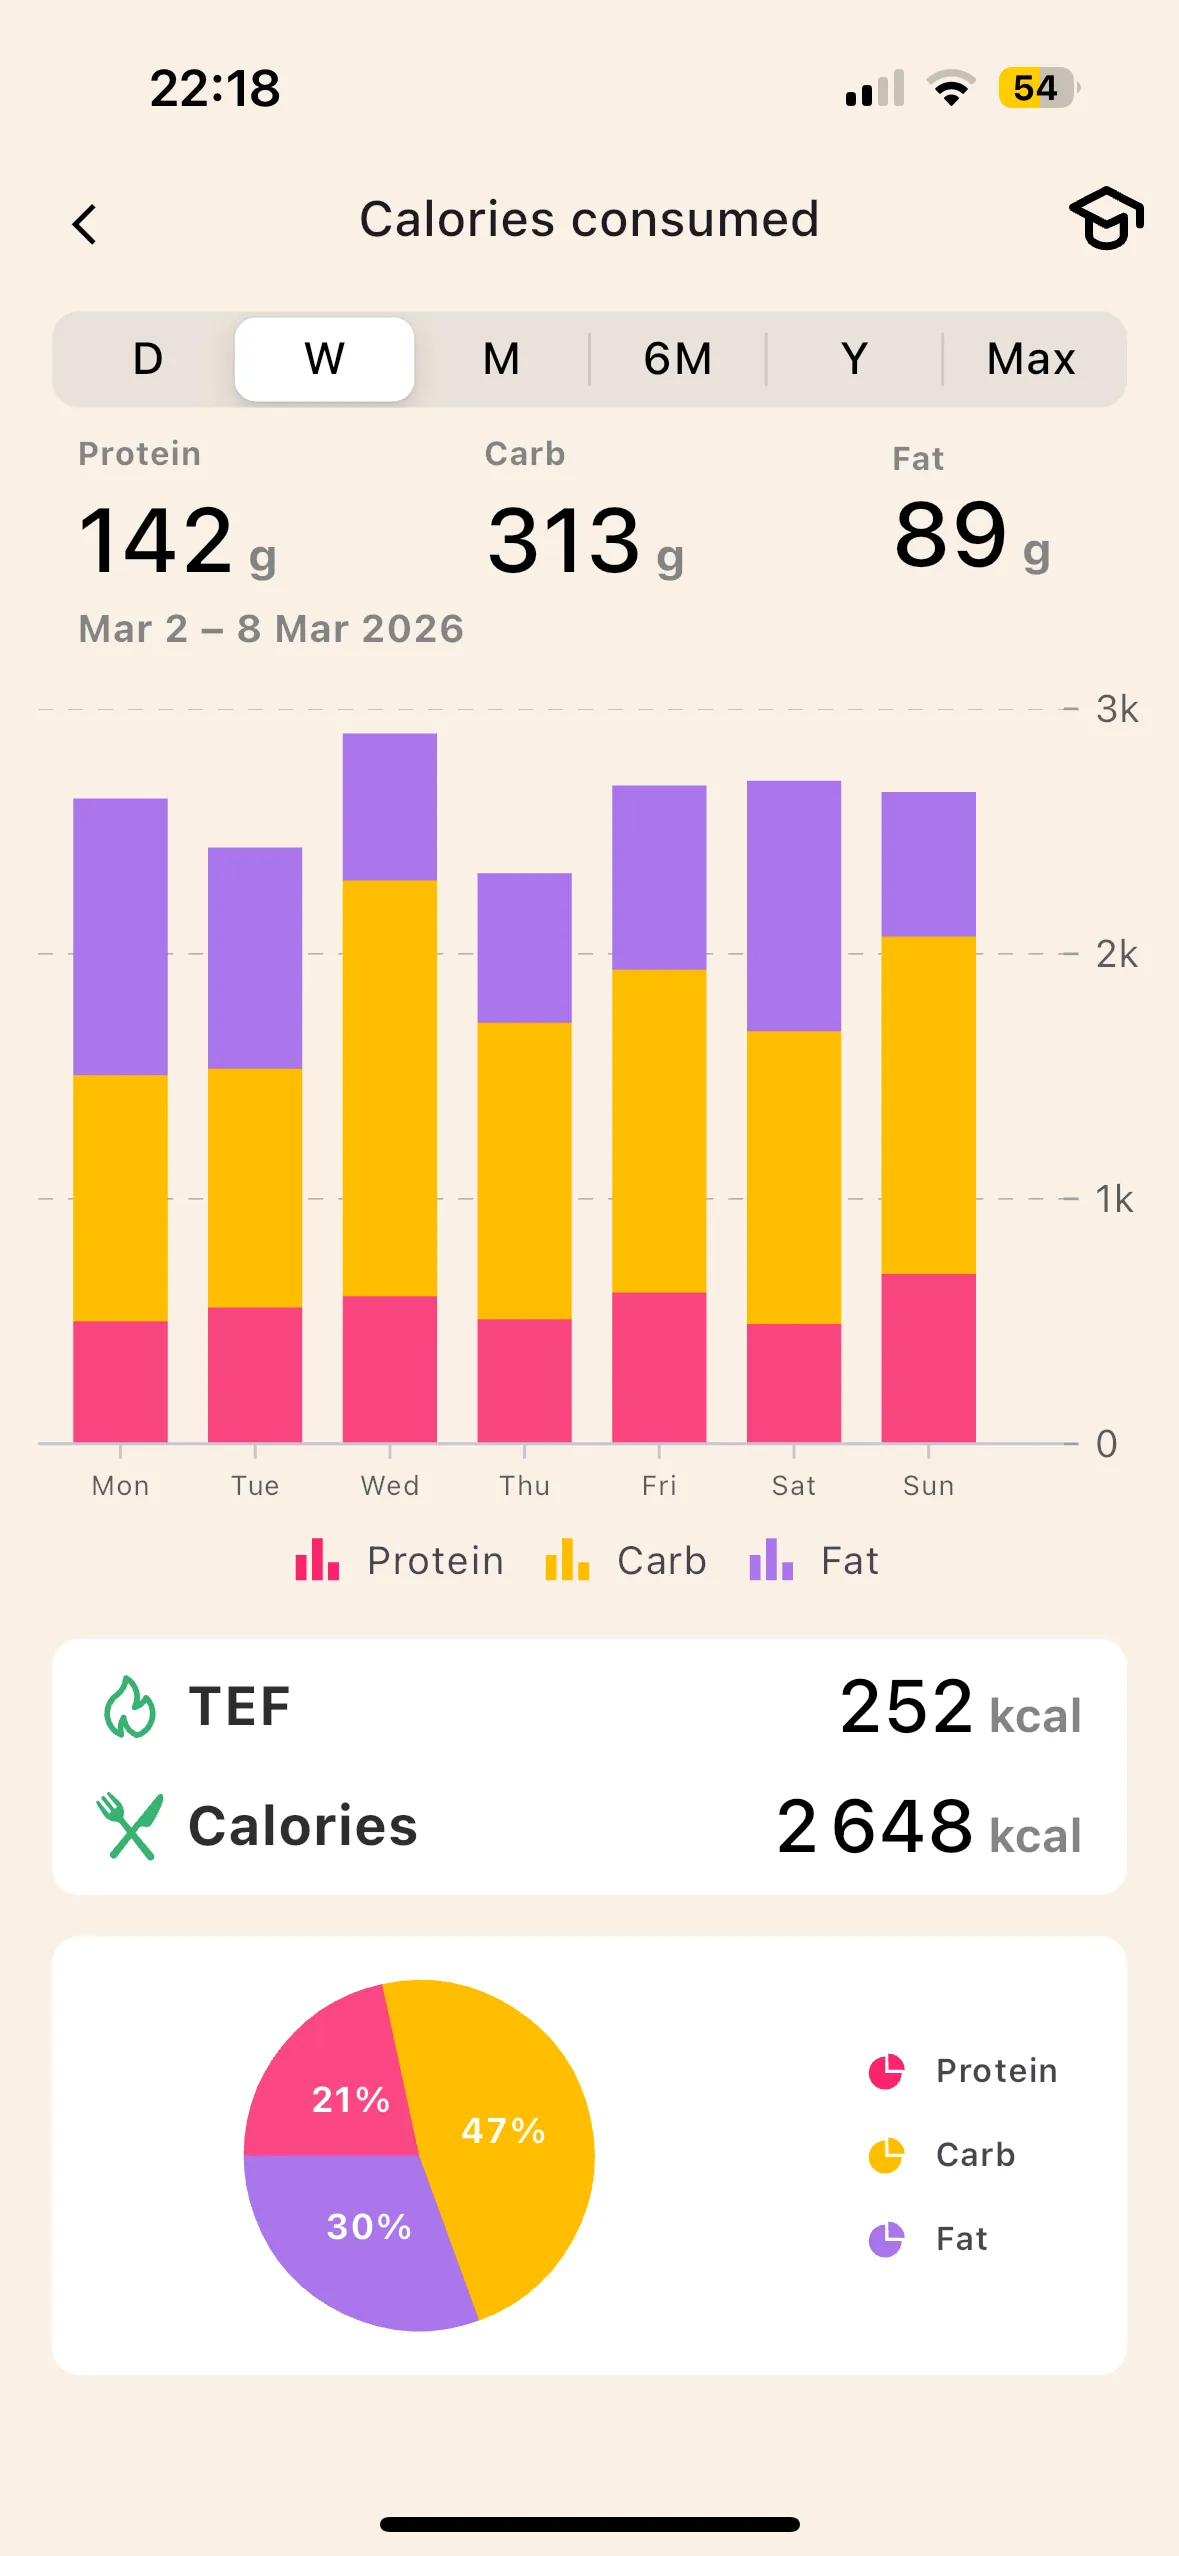
A world first on a consumer app
Metabolic adaptation. No database, however clean, detects that your metabolism has slowed by 12% after eight weeks of deficit. Lean estimates it week after week from the published ranges (Müller 2015, Doucet 2001) and corrects your TDEE accordingly.
Past 10 to 15% adaptation, the app may recommend a return to maintenance before starting a new deficit. The protocol of contest-prep coaches, applied to your data.
No activity factor to choose. Every component is measured, week after week.
Lean vs Cronometer, criterion by criterion
An honest read of each app's strengths and weaknesses. No criterion touches price.
 Lean Cronometer
3 ways to track a meal
Cronometer's rigor comes at a cost: logging time. Lean offers three logging methods so that precision is not paid for with giving up after six weeks.
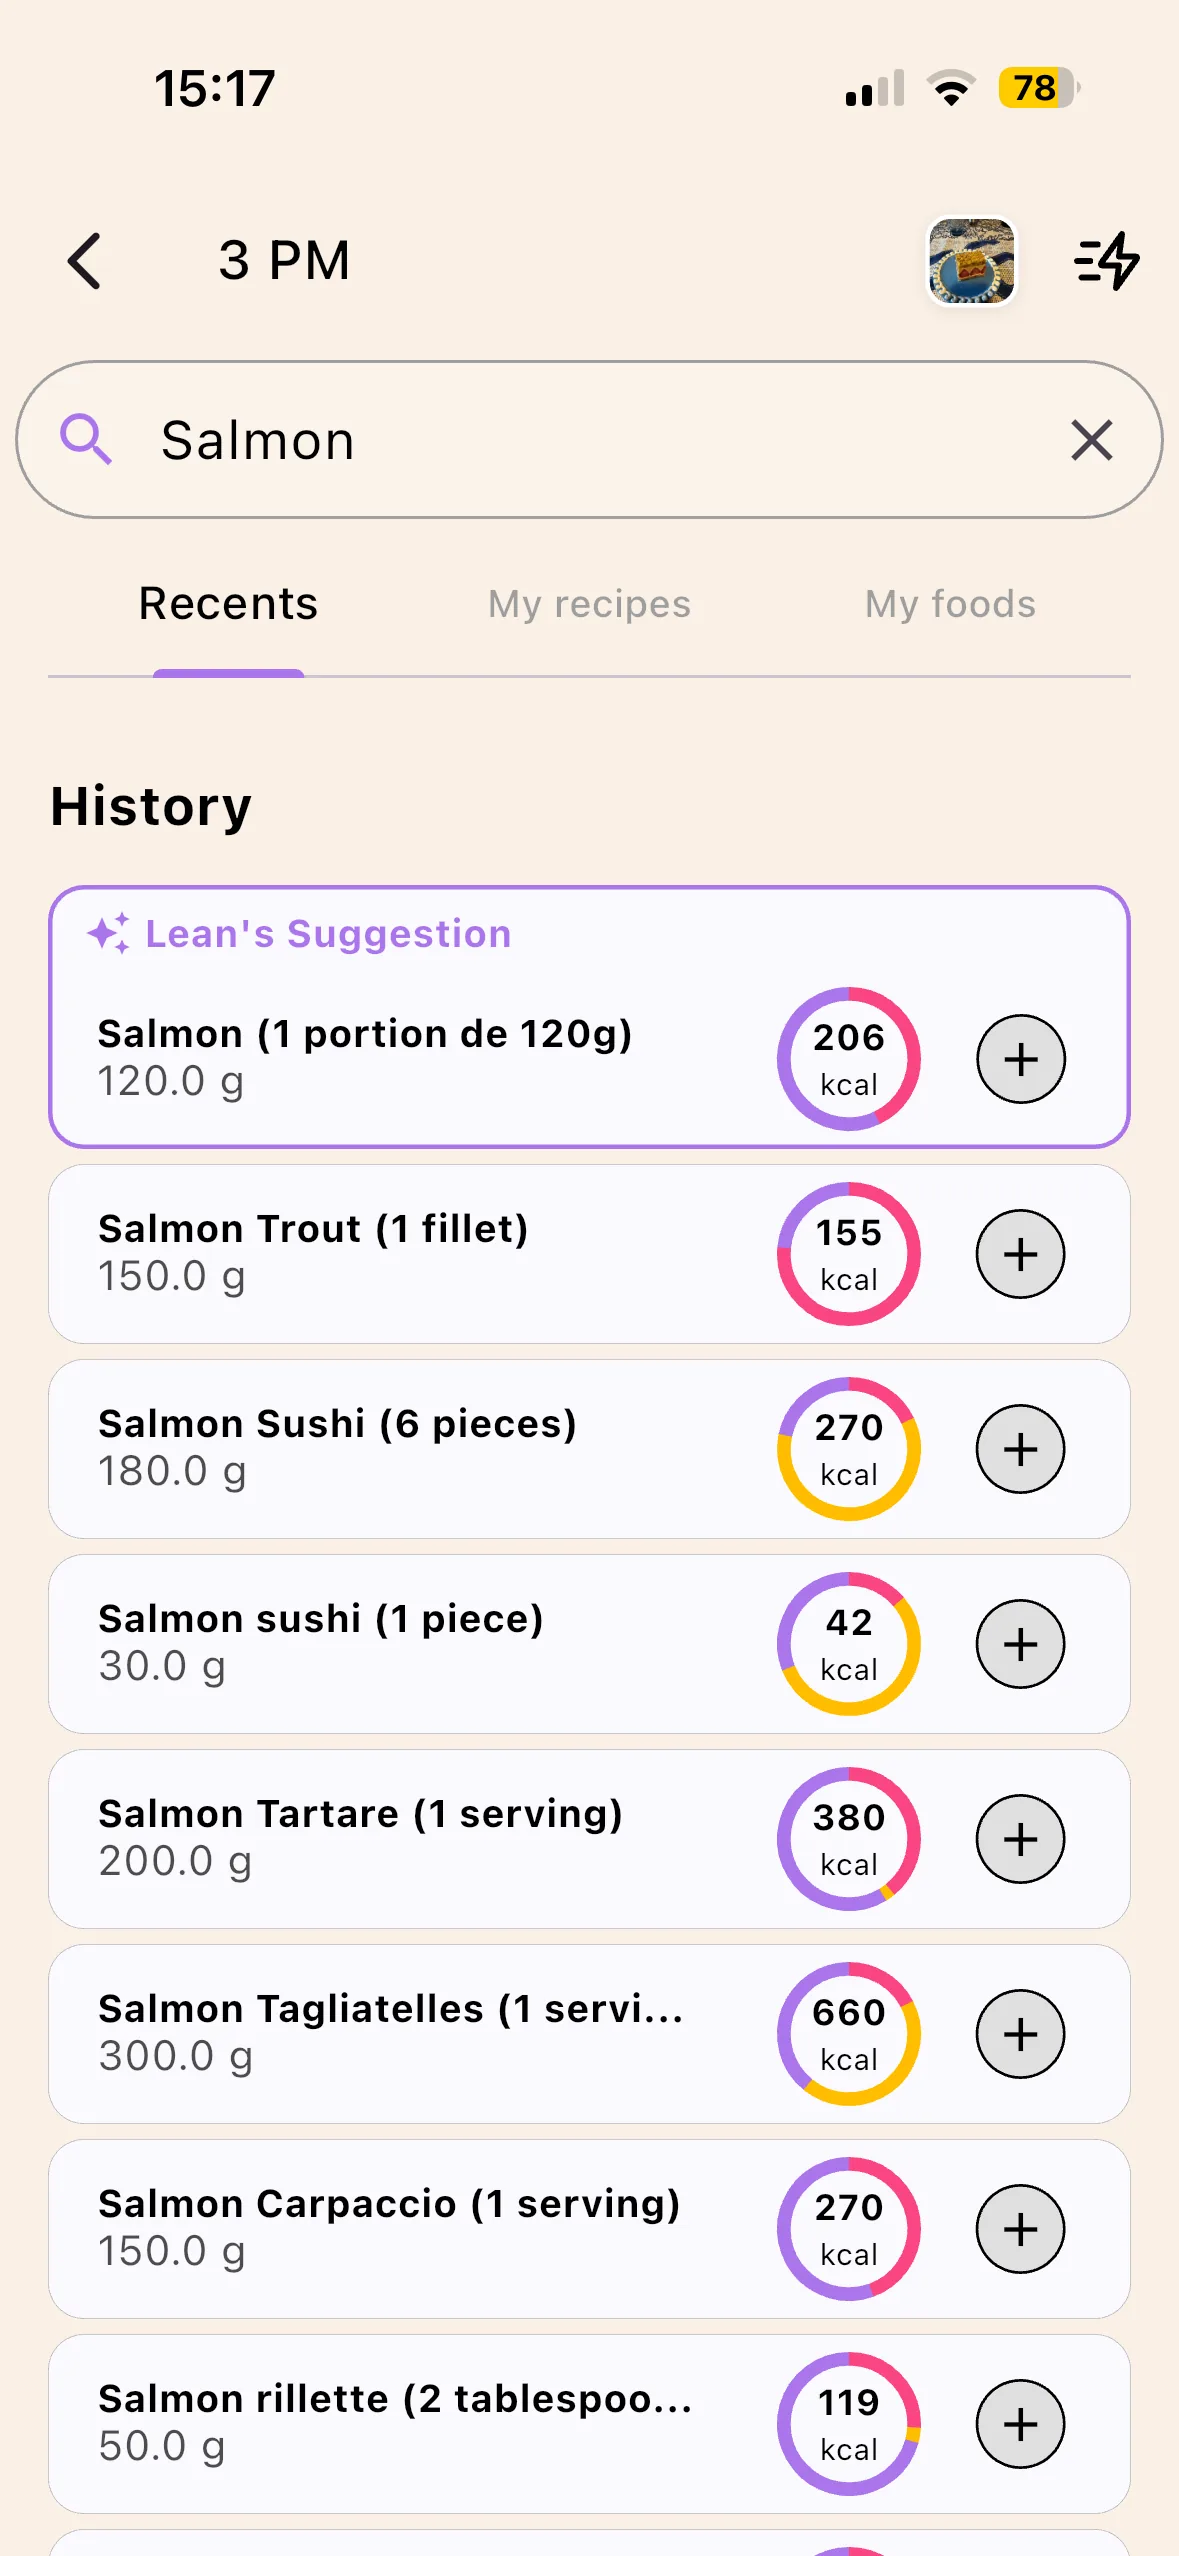
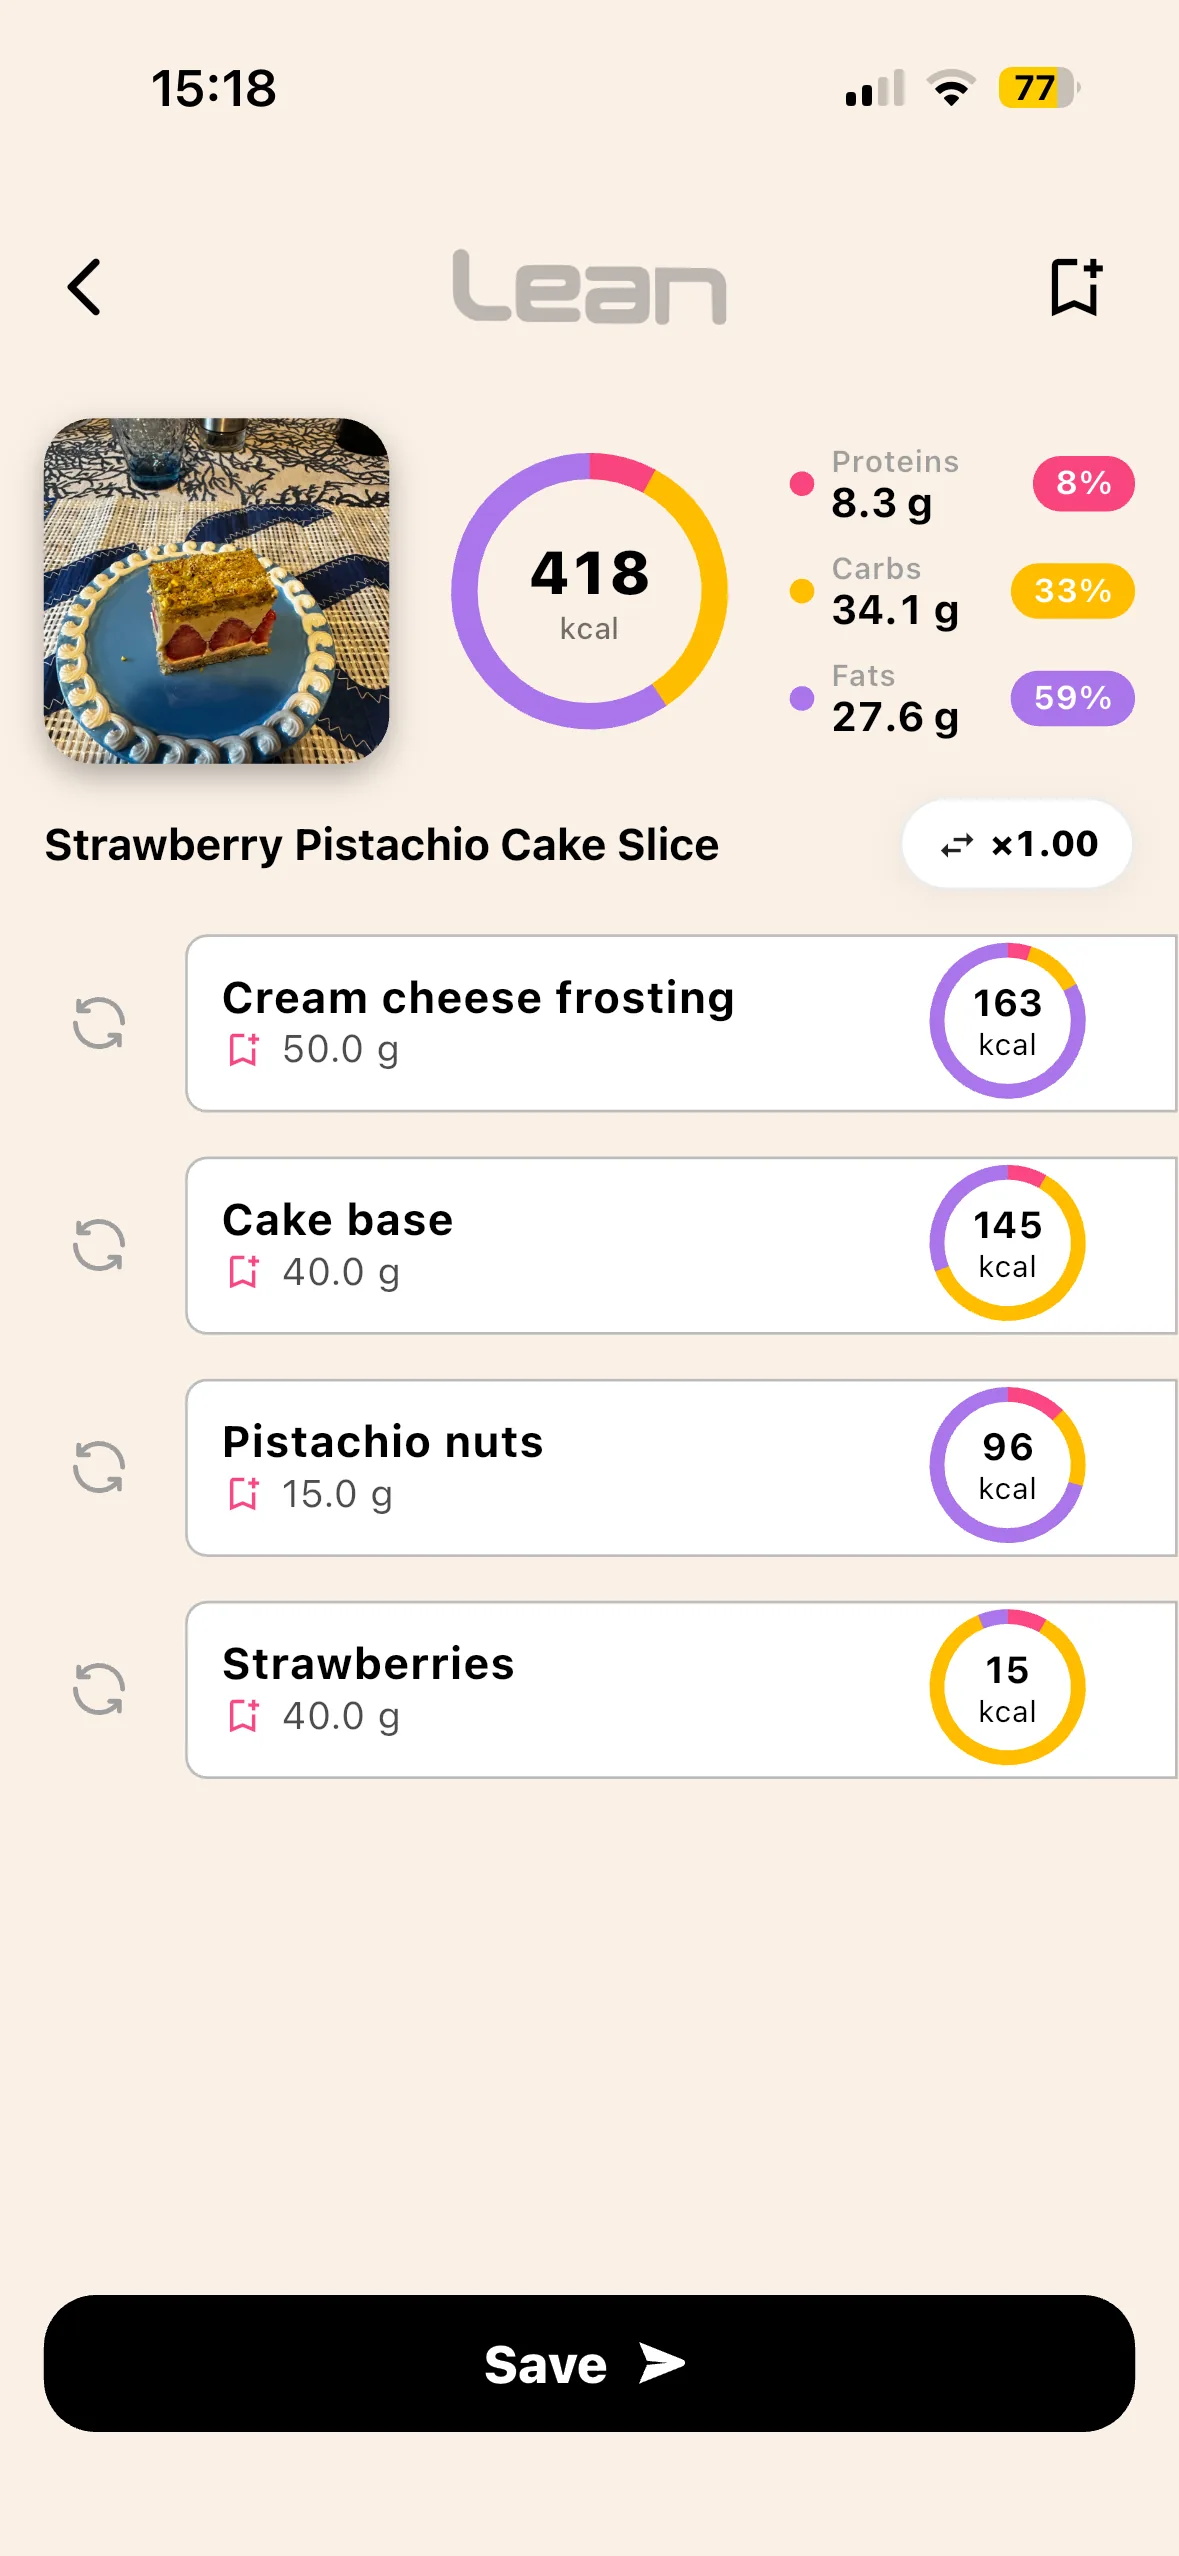
- Database search. Curated base, USDA + OpenFoodFacts. No community noise, no "Roast chicken" entered 47 times by 47 different users with 47 different values.
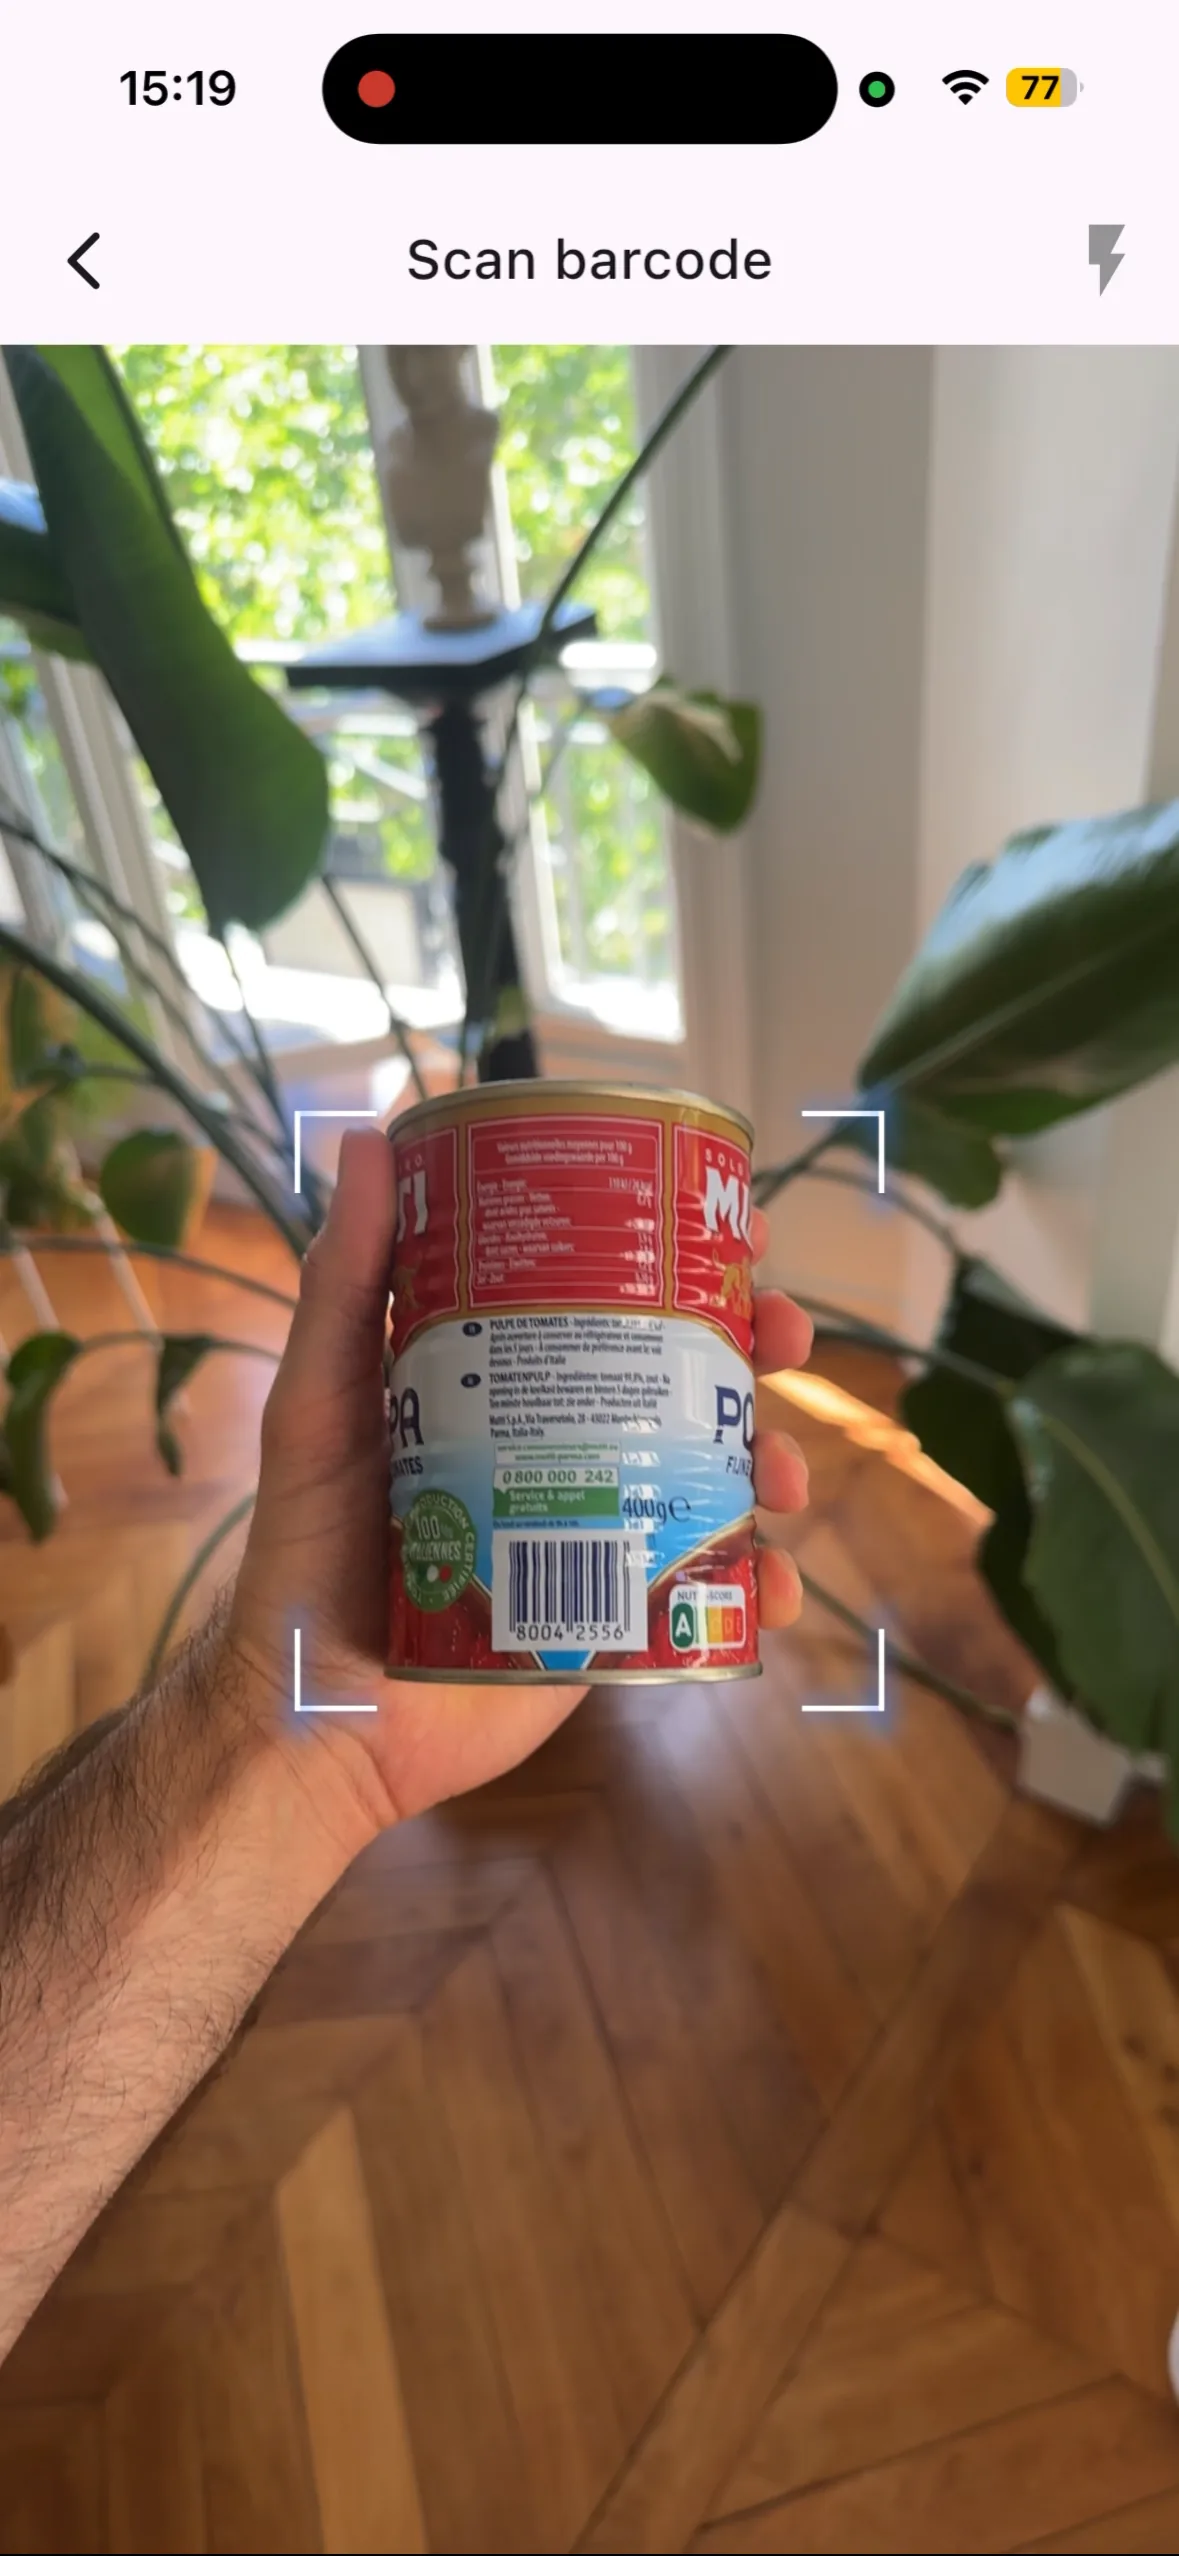
- Barcode scan. Standard. You scan your pasta box, you get the macros.
- AI photo scan of a meal. You photograph your plate, the AI detects the foods, you get the calories and macros per food.
AI photo scanning is the direct complement of a clean database: at the restaurant, with no label and no barcode, you photograph your plate instead of rebuilding the recipe ingredient by ingredient.
Beyond the meal, Lean shows a TDEE that evolves during the day with your steps. Cronometer gives you an exact nutritional snapshot; Lean adds the expenditure in motion.
And to set priorities, the Progression Pyramid:
What Cronometer does better
Lean is not perfect, and Cronometer has several real strengths that must be acknowledged. Honest read, criterion by criterion, on the axes where Cronometer stays ahead. None of these axes are secondary: they are real pillars of the Cronometer promise.
Cronometer LeanHonest read. On micronutrients, Cronometer is the absolute reference: 80+ vitamins, minerals, omega-3/6, essential and non-essential amino acids, with DRI/RDA percentage display and trend graphs. No other consumer app comes close to this depth. Lean shows macros and calories, that's it. On the food database, Cronometer relies on NCCDB (the most rigorous database on the consumer market, hand-curated by their team), plus USDA and IFNDC. Lean relies on USDA and curated OpenFoodFacts, which covers daily uses well but does not go as deep on the quality of exotic entries or processed products. On professional adoption, Cronometer is used by a huge number of registered dietitians (RDs) and sports coaches as a reference tool for the weekly micronutrient review of their clients.
If your main angle is micronutrient optimization (pre-competition, demanding restrictive diet like vegan or keto, iron/B12/D deficiency prevention), or if you need a tool that your RD or coach can audit in a consultation, Cronometer is more relevant than Lean. If your angle is the precision of the TDEE calculation, the bodyfat measured every week via BodyScan AI, and automatic metabolic adaptation, that's exactly what was just demonstrated in the previous 3 sections. Many advanced users run both apps in parallel, and that's entirely defensible.
Who Lean is built for
Four profiles. If one of them sounds like you, Lean is likely a good fit.
You used Cronometer seriously and you didn't lose
You keep a rigorous food log, you know your micronutrients, and yet fat loss is not following.
You plateau after several weeks of cutting
The plateau shows up after four to eight weeks even though your logging is flawless. That is metabolic adaptation: it concerns expenditure, not intake.
You want to understand your metabolism
You want the same analytical rigor on the expenditure side: BMR, NEAT, EAT and TEF broken down, adaptation handled separately.
You want tracking that lasts 12 months
You want to cut logging time without giving up reliability: photo, curated database or barcode depending on the situation.
Cronometer remains more relevant for : deep micronutrient tracking (vitamins, minerals, omegas, amino acids), restrictive diets (vegan, keto, low-FODMAP) where deficiency prevention is critical, or the shared review with your registered dietitian (RD). TDEE precision and metabolic adaptation just aren't part of its main promise.
Switching from Cronometer to Lean (or using both) in 3 minutes
Download Lean
App Store or Play Store. Sign-up in thirty seconds.
AI BodyScan
One photo, five seconds: your body fat percentage appears, with no DEXA and no manual entry.
Weight & height
You enter your weight and height, and the calculation starts.
Lean calculates
BMR on measured lean mass, NEAT from your steps via HealthKit or Google Fit, EAT by MET, TEF on your macros, and metabolic adaptation tracked week after week.
Log a meal
Photo, barcode or curated database: logging adapts to the context.
Important note. Lean does not import your Cronometer history automatically, nor your custom foods. If you want to keep a weekly micronutrient check in parallel, many advanced users keep logging 1 or 2 days a week in Cronometer for the vitamin check, while using Lean daily for the TDEE and the main tracking. The HealthKit / Google Health Connect sync, on its side, takes over immediately for your steps and your activity history.
What Lean does, that Cronometer does not (on the TDEE)
Six expenditure-focused features, where most tools concentrate their precision on intake.
Your body fat percentage measured from a photo every week. The data the Katch-McArdle equation requires, produced automatically instead of typed in by hand.
A meal logged in two seconds by photo, when rebuilding a recipe ingredient by ingredient would take several minutes.
Your TDEE corrects itself week after week according to the published ranges. No food log, however precise, detects this drift.
BMR, NEAT, EAT and TEF displayed separately and updated during the day: the same analytical rigor applied to expenditure.
Your weight, body fat and lean mass trends over several months, to read your cycles beyond daily variation.
A hierarchy of priorities: adherence, calorie target, steps. Useful when data abounds and you need to know where to start.
You install the app for free, you try it without commitment, then you decide if the tool fits your goal.
Frequently asked questions
Cronometer is the micronutrient reference, why compare it to Lean on the TDEE ?
Why doesn't Cronometer calculate the BMR on real bodyfat by default ?
Does Lean track micronutrients like Cronometer ?
Cronometer imports steps via HealthKit, is that enough for NEAT ?
Is Lean free or paid?
Can you use Lean and Cronometer in parallel ?
1990 vs 2026
This is not a marketing duel. It is intake precision versus expenditure precision: two complementary requirements.
Cronometer remains unbeatable for anyone who wants to track micronutrients with a rigorous USDA database and an active scientific community.
Lean handles the other half of the calculation: a metabolism computed on lean mass measured by AI BodyScan with a patented proprietary model, NEAT from your real steps, EAT by MET, TEF on your macros, and metabolic adaptation tracked week after week.
Food database quality and analytical depth remain Cronometer's strengths. If your log is flawless and progress has stopped, the expenditure side is where to look.
Lean is available as a free download
iOS and Android. The AI BodyScan works from a single photo: no skinfold calipers, no impedance scale, no DEXA.
Internal links
- Free online TDEE calculator · web version, no sign-up, same logic as the app (BMR + NEAT + EAT + TEF).
- Understand TDEE in depth (BMR, NEAT, EAT, TEF, adaptation) · deep-science article.
- How to count your calories properly · practical guide for beginners.
- NEAT: expenditure from steps and non-exercise activity.
- TEF: digestion burns calories.
References
- Harris J.A., Benedict F.G. (1919). A Biometric Study of Basal Metabolism in Man. Carnegie Institution of Washington.
- Mifflin M.D. et al. (1990). A new predictive equation for resting energy expenditure in healthy individuals. American Journal of Clinical Nutrition.
- Katch V.L., McArdle W.D. (1973). Prediction of body density from simple anthropometric measurements in college-age men and women. Human Biology.
- Frankenfield D.C. et al. (2013). Validation of Mifflin-St Jeor equation in obese and non-obese populations. PubMed 23631843.
- Westerterp K.R. (2004). Diet induced thermogenesis. Nutrition and Metabolism.
- Müller M.J., Bosy-Westphal A. (2013). Adaptive thermogenesis with weight loss in humans. Obesity.
- Schakel S.F., Sievert Y.A., Buzzard I.M. (1988). Sources of data for developing and maintaining a nutrient database (NCCDB). Journal of the American Dietetic Association.